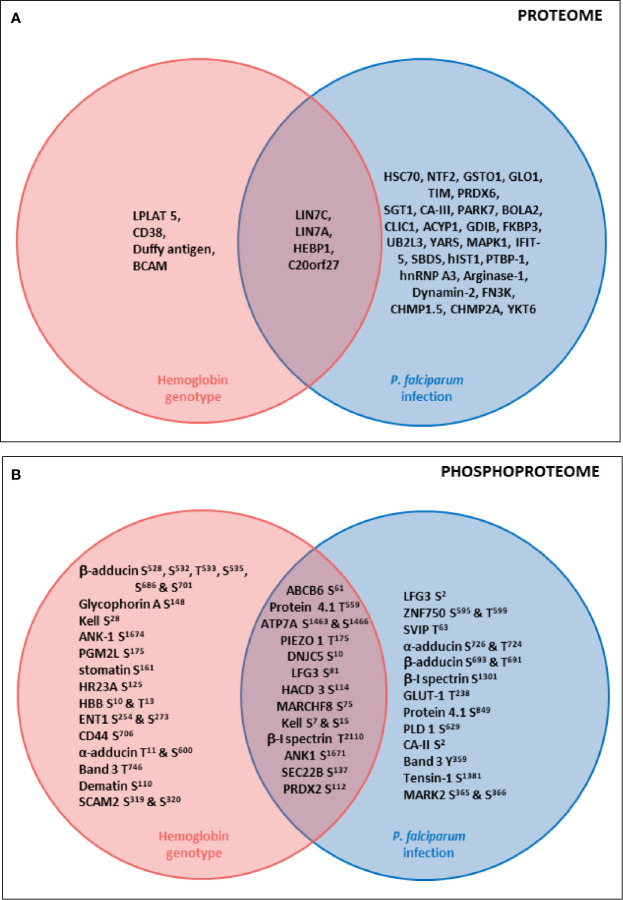
Figure 7.
Summary diagrams of proteome (A) and phosphoproteome (B) modulations of erythrocyte proteins according to P. falciparum infection and HbS carriage. Venn diagrams describing proteins whose quantity (A) or phosphorylation intensity (B) are varying according to hemoglobin genotype, P. falciparum infection or both parameters. Uniprot short names of proteins were represented, and phosphosites indicated. Erythrocyte proteins whose quantity (A) or phosphorylation intensity (B) was varying according to only hemoglobin genotype (ANOVA test) were presented in the pink circle. Erythrocyte proteins whose quantity (A) or phosphorylation intensity (B) was varying according to only P. falciparum infection (ANOVA test) were presented in the blue circle. Erythrocyte proteins whose quantity (A) or phosphorylation intensity (B) was varying according to both hemoglobin genotype and P. falciparum infection (ANOVA test) were presented in the junction between the pink and the blue circle.

