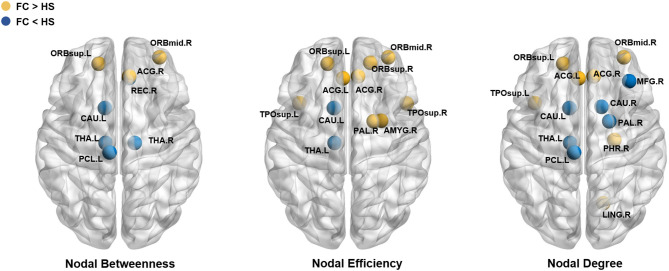
Figure 3.
Brain regions showed significant difference in nodal characteristics between two groups (P < 0.05, FDR corrected). Every node denotes a brain region, the blue nodes represent the value of FC< the value of HS, the yellow nodes represent the value of FC > the value of HS. The abbreviations of the 90 brain regions were given in Supplementary Materials.

