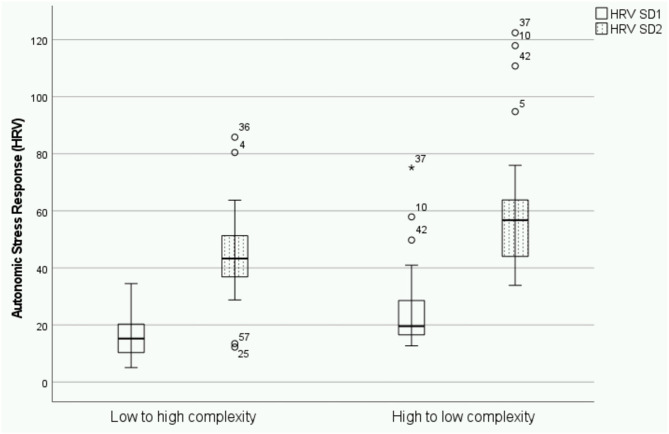
Figure 2.
Box plot displaying differences on the effect of the order of presentation of high and low complexity/difficulty scenarios on SD1 and SD2 as measures of autonomic stress response. The asterisk in the boxplot represents extreme values (points at a greater distance from the median than 1.5 times).

