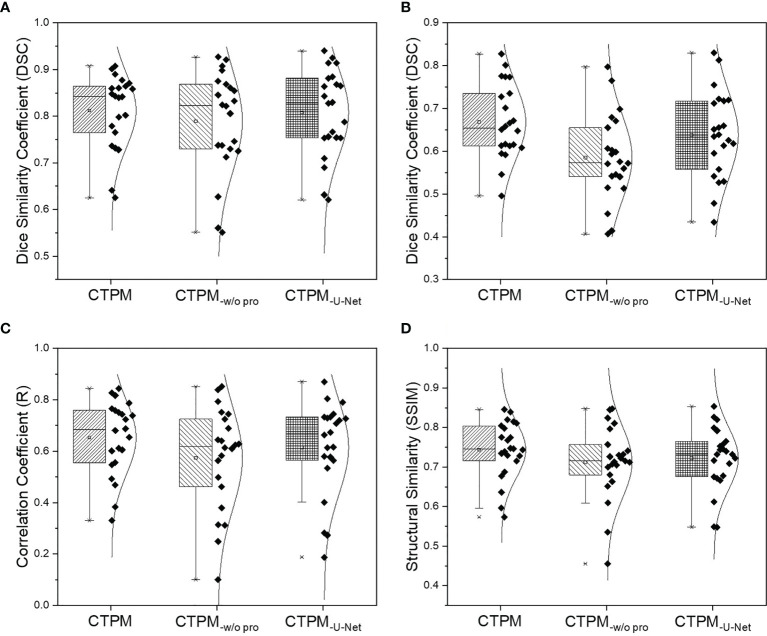
Figure 5.
Overall performance analysis of the CTPM framework for the testing group. (A) DSC of the high functional lung. (B) DSC of the low functional lung. (C) Correlation coefficient. (D) Structural similarity. CTPM-w/o pro indicates prediction without image processing. CTPM-U-Net indicates prediction using U-Net.

