
Figure 6.
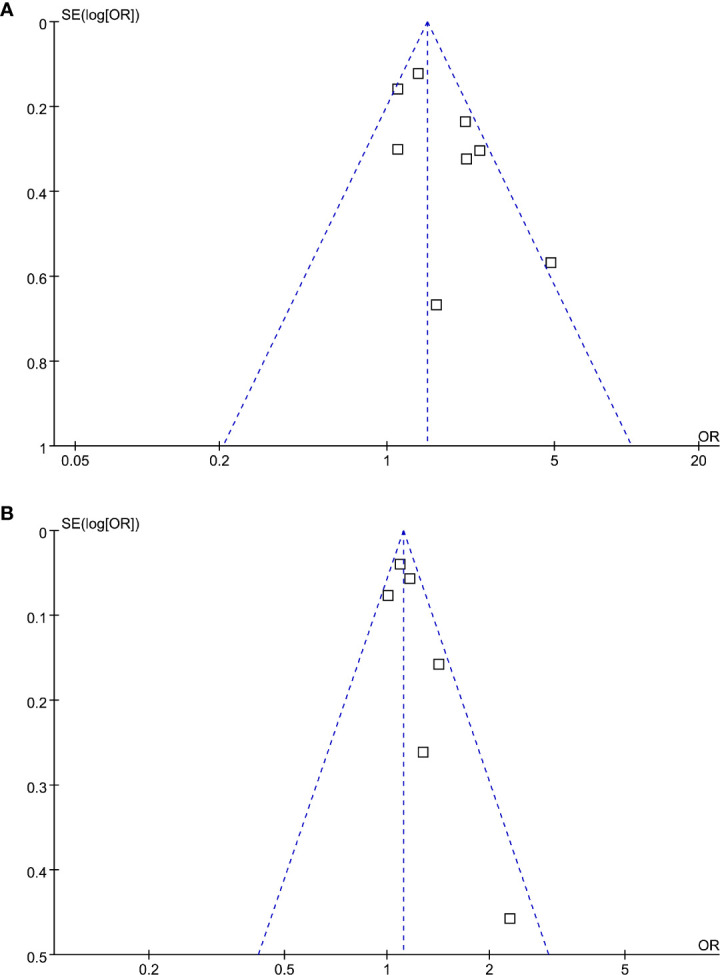
Funnel plots for the publication bias underlying the meta-analysis of the association between Lp (a) and diabetic nephropathy in T2DM patients. (A) Forest plots for the meta-analysis of studies with Lp (a) analyzed as categorized variables and (B) forest plots for the meta-analysis of studies with Lp (a) analyzed as continuous variables.