
Fig. 2.
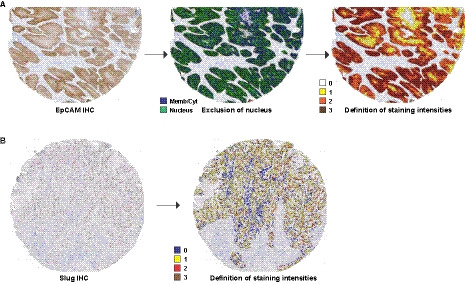
Software‐based determination of EpCAM and Slug expression intensities in HNSCC tissue microarrays. (A) Tissue microarray samples stained for the expression of EpCAM were analyzed with the Definiens Developer XD2 (Definiens AG) to identify nuclei and the remaining membrane and cytoplasmic areas (middle panel). EpCAM staining intensity was thereafter determined in the membrane/cytoplasm as no (0, white), weak (1, yellow), intermediate (2, orange), to high expression (3, brown). (B) Tissue microarray samples stained for the expression of Slug were analyzed with the Definiens Developer XD2 (Definiens AG) to identify nuclei and Slug staining intensities were determined as (0, blue), weak (1, yellow), intermediate (2, red), to high expression (3, brown).