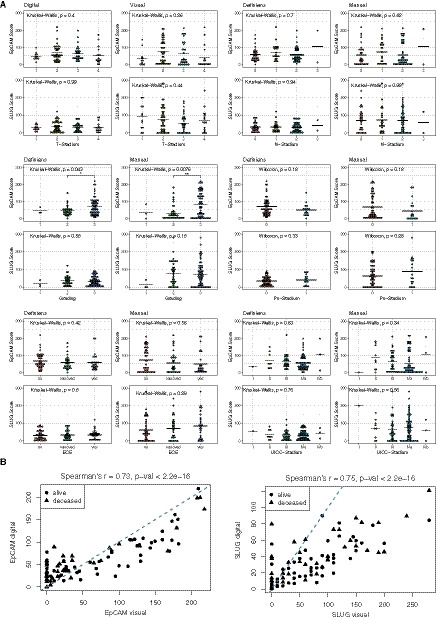
Fig. 3.

Correlation of EpCAM and Slug expression levels with clinical parameters of HNSCC patients. (A) Digital and visual quantification of EpCAM (upper panels) and Slug (lower panels) expression levels was classified according to the T‐ and N‐status, grading, perineural invasion (Pn‐status), extracapsular extension (ECE), and the UICC‐status (Union International Contre le Cancer). EpCAM and Slug expression scores (0–300) for all n = 96/102 HNSCC patients are presented as jitter plots with mean values (line) and P‐values from Kruskal–Wallis tests (group size > 2) or Wilcoxon tests (group size = 2). (B) IHC scores from the digital and visual quantification of EpCAM and Slug are presented a percentage of the maximal scores. Shown are correlation curves with rho (r) and P‐values from Spearman´s rank correlation analyses. Patients’ survival or death is depicted squares and circles, respectively. Specific P‐values are indicated.
