
Fig. 4.
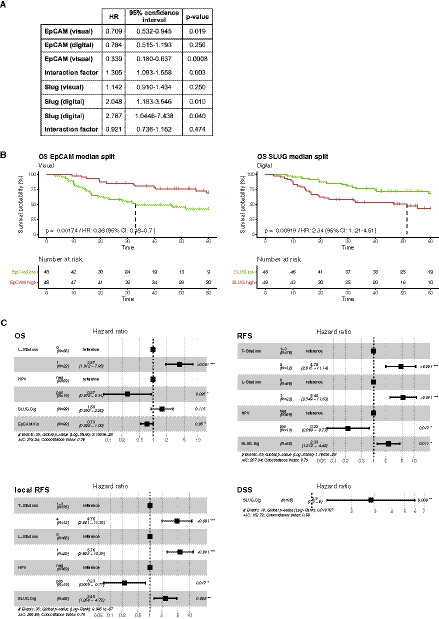
Stratification of HNSCC patients according to EpCAM and Slug expression for clinical endpoints. (A) Hazard ratios (HR), 95% confidence intervals, and P‐values are indicated for each antigen and evaluation technique per 50 units of IHC score. (B) Stratification of HNSCC patients according to median expression over a time period of 5 years (time is given in months) is shown as Kaplan–Meier curves for with HR, 95% CI, P‐values, and numbers of patients at risk in each risk group over time (antigen high and low, red and green color, respectively). (C) Multivariable analyses of overall survival (OS), recurrence‐free survival (RFS), locoregional recurrence‐free survival (LR‐RFS), and disease‐specific survival (DSS). Shown are Forest plots from multivariable Cox proportional hazard models including all variables shown to have prognostic significance in univariable analyses for each clinical endpoint with HRs, 95% CIs, events, Akaike information criterion (AIC), Concordance index, global log‐rank P‐values, and variable‐specific P‐values. Dig, digital scoring; HPV, human papillomavirus; L‐status, lymph vessel invasion; T‐status, tumor size; Vis, visual scoring. HRs and CIs are indicated for each antigen and evaluation technique per 50 units of IHC score.