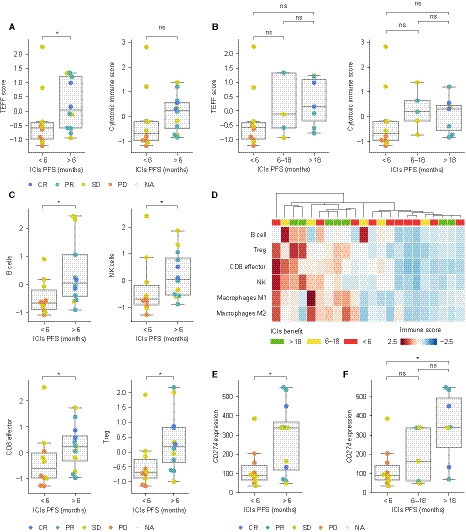
Fig. 2.

Immune expression profiling of tumor’s microenvironment. (A, B) TEFF and cytotoxic score distribution across groups of ICIs benefit. For each patient, the value of each signature has been computed as the geometric mean of the expression of all genes in the signature. Next, for each of the scores, all values have been standardized. Color indicates best response to ICIs (CR: complete response, PR: partial response, SD: stable disease, and PD: progressive disease). (C) Distribution of expression signatures belonging to four different immune cell populations across groups of benefit. Values computed as in panel A. Color indicates best response to ICIs. (D) Representation of different immune populations across 22 patients. Columns and rows correspond to patients and specific immune cell populations, respectively. Patients have been clustered using a hierarchical clustering algorithm based on their degree of similarity considering amount and type of tumor immune infiltration. (E) CD274 expression distribution according to indicated group of benefit. Color indicates best response. Mann–Whitney–Wilcoxon tests have been used to determine differences between ICIs benefit groups (A, B, C, E, F); ns: 0.05 < P ≤ 1.0; *: 0.01 < P <0.05; **: 0.001 < P ≤ 0.01.
