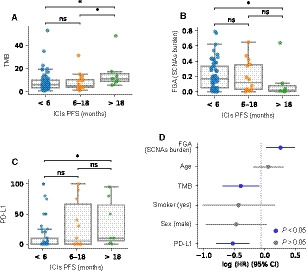
Fig. 4.

NSCLC‐MSK cohort analysis. (A) TMB, (B) FGA (SCNAs burden), and (C) PD‐L1 distribution across groups of ICIs benefit. Mann–Whitney–Wilcoxon tests have been used to determine differences between clinical benefit groups (A, B, C). ns: 0.05 < P ≤ 1.0; *: 0.01 < P < 0.05. (D) Multivariate Cox proportional hazards model for FGA (SCNAs burden), age, TMB, smoking status, sex, and PD‐L1, stratified by histology. Features represented in blue are statistically significant (P < 0.05).
