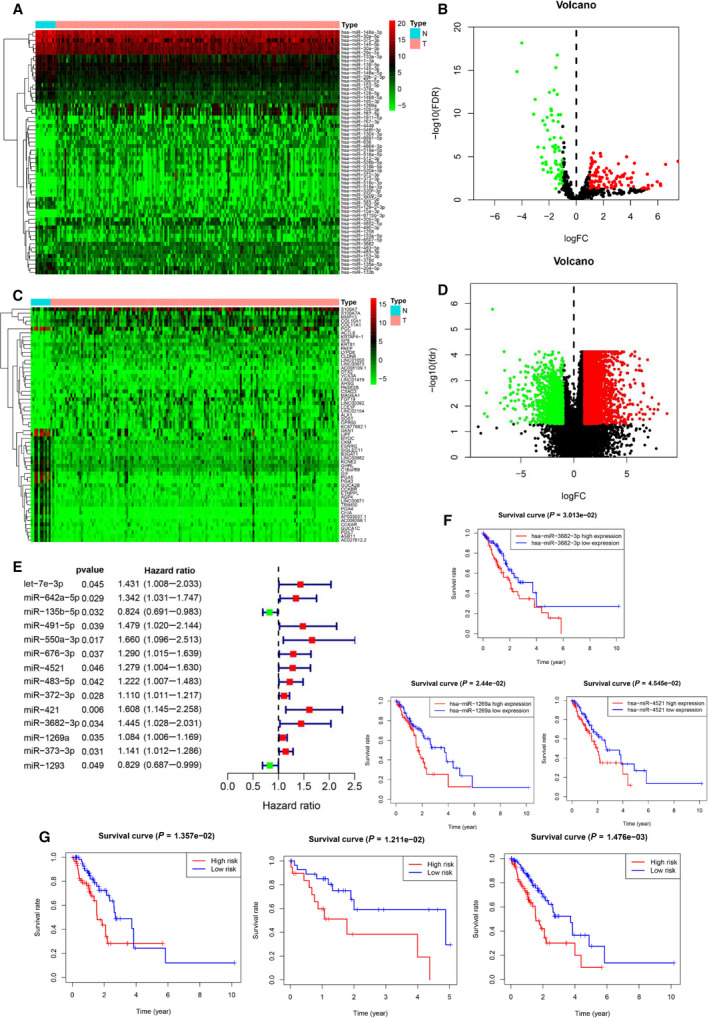
Fig. 1.

Differentially expressed miRNAs (DEMs) and differentially expressed genes (DEGs)in EC. (A) Top 20 of up‐regulated and down‐regulated DEMs in EC. (B) Volcano plot of DEMs in EC. (C) Top 20 of up‐regulated and down‐regulated DEGs in EC. (D) Volcano plot of DEGs in EC. (E) Forest plot of univariate Cox analysis of DEMs filtered 14 miRNAs. (F) Three miRNAs associated with OS in EC patients using Kaplan–Meier curves and log‐rank tests. (G) Kaplan–Meier curves validated and evaluated three miRNA signature in the training group (left panel), test group (median panel), and all group (right panel).
