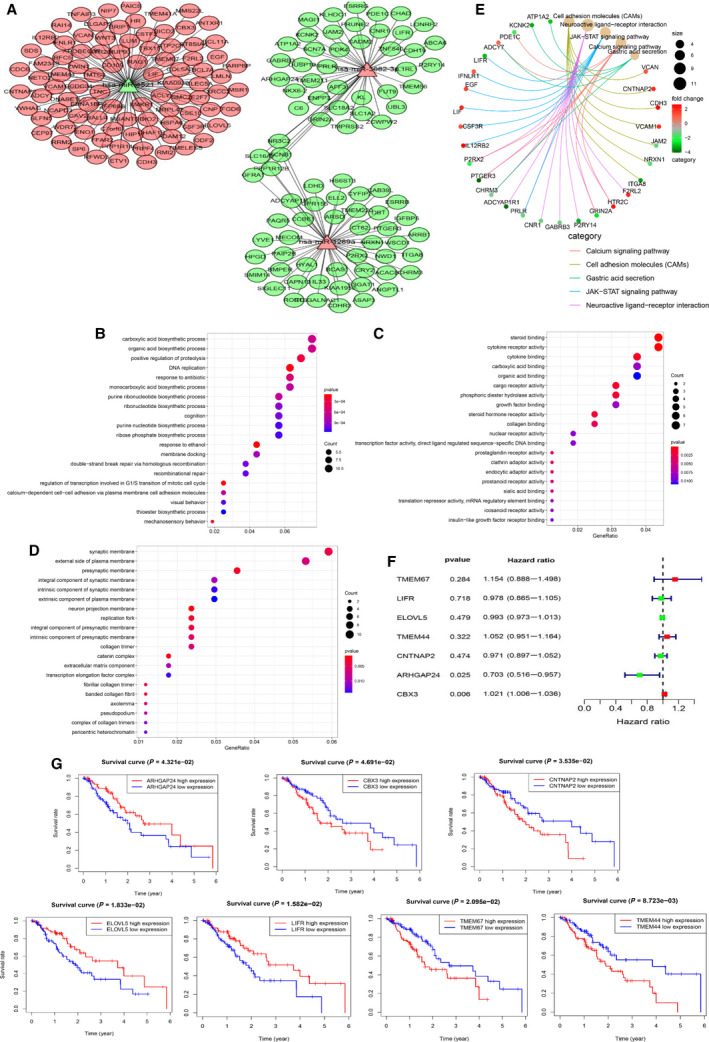
Fig. 3.

Functional analysis for three miRNA‐based signature and its target genes. (A) Network showing mRNAs negatively regulated by miRNAs. Red denotes up‐regulated; green denotes down‐regulated. (B‐D) Bubble plots showing GO analysis of target genes for BP (B), CC (C), and MF (D). (E) KEGG pathway analysis of the pathway‐gene network presented by cnetplot. (F) Univariate Cox analysis of seven target genes in EC. (G) The association of seven target genes with patients’ prognosis of EC.
