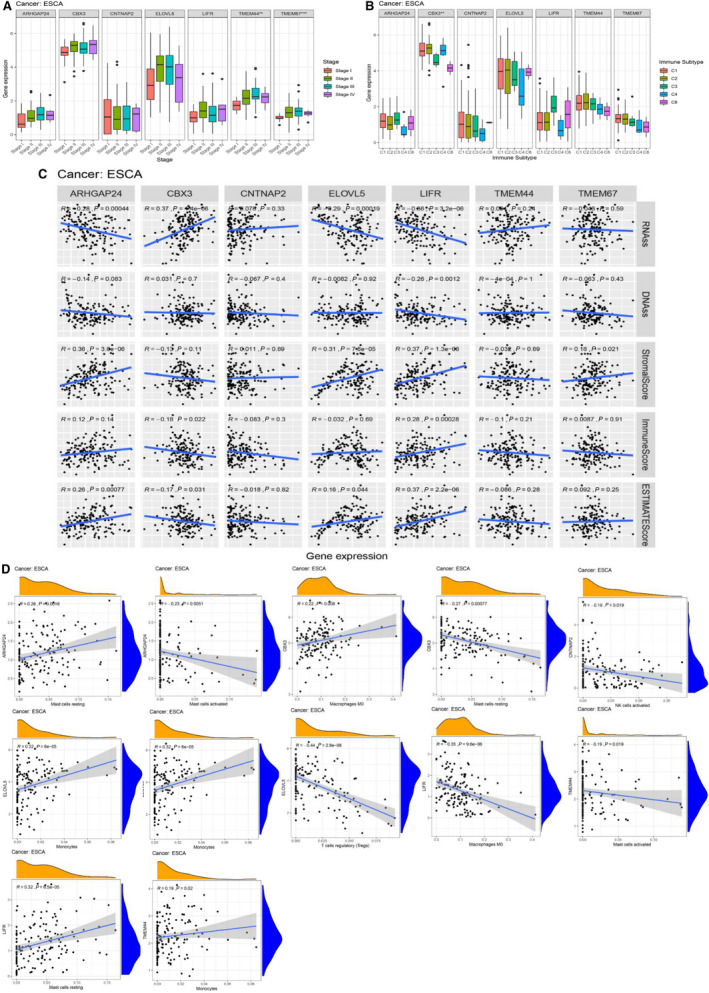
Fig. 4.

Association of expression of target genes with multiple factors. (A) Association of target genes with clinical stage of EC. (B) Association of target genes expression with immune subtypes in EC patients. (C) Correlation of expression of target genes with cancer stem cell‐like properties (RNAss, DNAss) and TME (Stromal score, Immune score, and ESTIMATE score). *, **, *** represent P < 0.05, P < 0.01, and P < 0.0001, respectively. Spearman correlation analysis was used to calculate the association. (D) The top two significant immune‐infiltrated cells from each target genes are shown. No immune cell infiltration was associated with TMEM67 expression.
