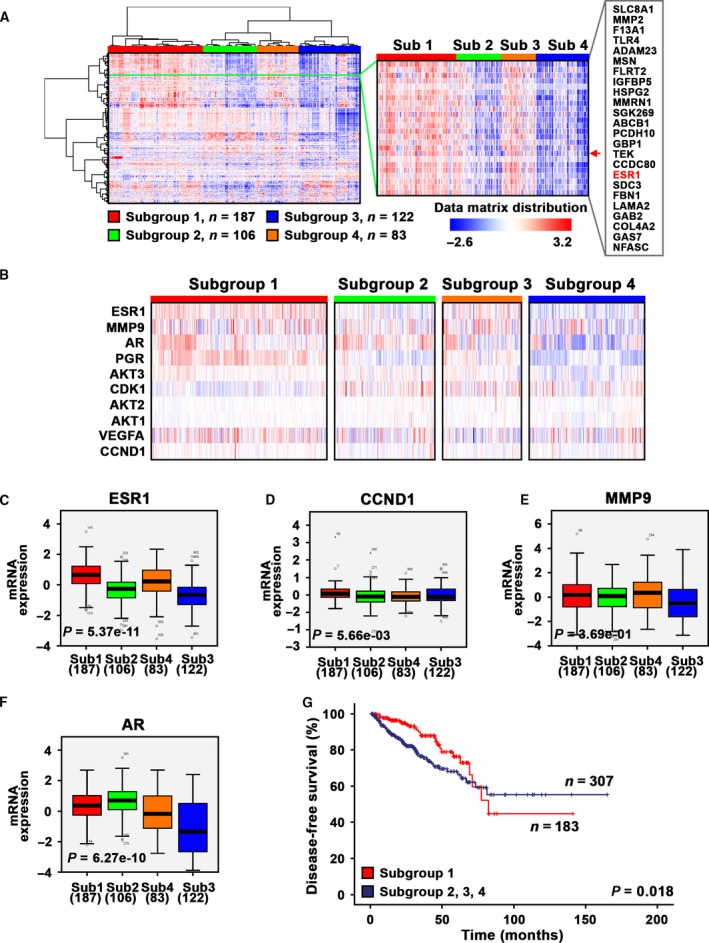
Fig. 3.

Clinical importance and gene expression signatures of estrogen‐associated signaling pathways in primary cancer tissues from PCa patients. (A) Hierarchical clustering of primary cancer tissues from a cohort of 498 PCa patients was performed based on their multilayer expression patterns of marker gene signatures. A dendrogram of the tumors from patients is shown at the top and left, with four distinct subclusters/subgroups denoted. The gene names are listed on the right. Red indicating high expression of each gene, and blue indicating low expression. (B) The magnified heatmap showing expression patterns of the key marker genes including ESR1, MMP9, AR, progesterone receptor (PRG), AKT3, CDK1, AKT2, AKT1, VEGFA and CCND1, which are the key marker genes that control proliferation, survival and invasion signaling pathways. (C–F). Box plots show that ESR1, CCND1, MMP9 and AR are significantly differentially expressed among the four subclusters/subgroups. The statistical program ANOVA was used. P values indicate significant differences among the four subclusters/subgroups are shown. (G) Kaplan–Meier survival curve revealed that patients from subcluster/subgroup 1 (n = 183) suffered poorer disease‐free survival (DFS) as compared to those from subclusters/subgroups 2–4 (n = 307). Differences in disease‐free survivals between two groups were calculated by using SPSS log‐rank statistical analysis. P value is indicated, P = 0.018.
