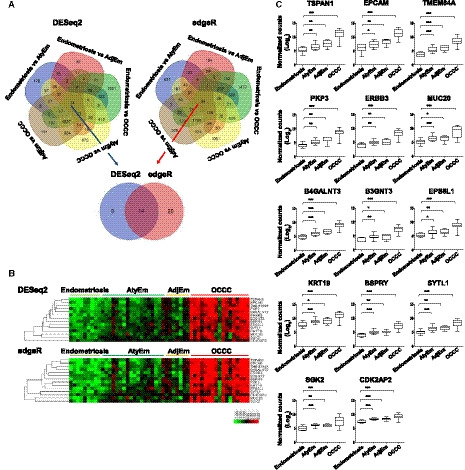
Fig. 1.

Identification of 14 upregulated genes by RNA sequencing. (A) Venn diagrams of the DEGs using DESeq2 and edgeR, based on five two‐group comparisons: Endometriosis versus AtyEm, Endometriosis versus AdjEm, Endometriosis versus OCCC, AtyEm versus OCCC, and AdjEm versus OCCC. DEGs in the common intersection are identified by DESeq2 (14 genes, blue arrow) and edgeR (34 genes, red arrow). Fourteen common genes were identified. (B) Heat map showing the expression of 14 genes in the four groups. (C) Individual gene expression profiles of the 14 genes in four groups. Normalized read counts were obtained using DESeq2. Unpaired t‐test was performed. *P < 0.05, **P < 0.01, ***P < 0.001.
