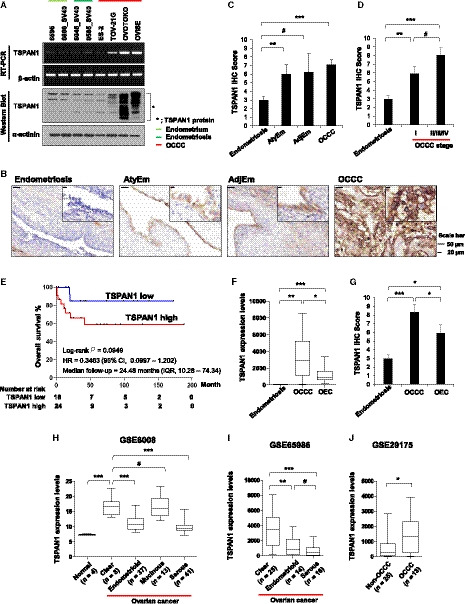
Fig. 2.

TSPAN1 is highly expressed in human OCCC cells and tissue specimens. (A) mRNA and protein levels of TSPAN1 were assessed using RT‐PCR (upper panel) and immunoblotting (lower panel) in cell lines. The expressions of β‐actin and α‐actinin were included as internal loading controls. (B) Representative immunohistochemical staining images of TSPAN1 in FFPE tissues. Scale bar = 50 or 10 μm; 200× or 1000× magnification. (C) Immunohistochemistry staining scores of TSPAN1 in Em, AtyEm, AdjEm, and OCCC. Data are expressed as the mean ± standard error (SE). Mann–Whitney test was performed. *P < 0.05, ***P < 0.001. (D) Immunohistochemistry staining scores of TSPAN1 according to OCCC stage. Data are expressed as the mean ± SE. Mann–Whitney test was performed. *P < 0.05, ***P < 0.001. (E) Overall survival curves for OCCC (n = 42) according to TSPAN1 expression using Kaplan–Meier curve analysis. (F, G) TSPAN1 expression as shown by RNA sequencing analyzed by DESeq2 and the immunohistochemical scoring scores in endometriosis, OCCC, and OEC. *P < 0.05, **P < 0.01, ***P < 0.001. (H–J) mRNA expression levels of TSPAN1 were analyzed in an ovarian cancer cell line (GSE29175) and ovarian cancer patient tissues (GSE6008 and GSE65986) in three GEO databases. Unpaired t‐test was performed. *P < 0.05, **P < 0.01, ***P < 0.001.
