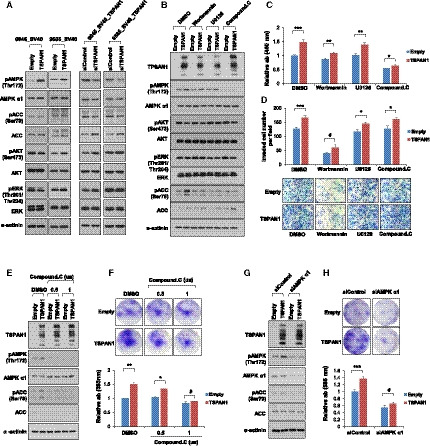
Fig. 4.

TSPAN1 increases cell growth through AMPK activity in the endometriosis cell line. (A) Protein levels were detected by immunoblotting in stable cell lines, with α‐actinin as an internal loading control (B) Protein levels were detected by immunoblotting after treatment of inhibitors in 6045_SV40 stable cell lines. (DMSO: control; 500 nm wortmannin: PI3 kinase inhibitor; 5 μm U0126: ERK inhibitor; 1 μm Compound C: AMPK inhibitor), with α‐actinin as an internal loading control. (C) Cell proliferation was determined via WST‐1 after treatment of inhibitors in 6045_SV40 stable cell lines. Unpaired t‐test was performed. *P < 0.05, **P < 0.01, ***P < 0.001. (D) Cell invasion analysis of stable cell lines using a Matrigel invasion assay after treating 6045_SV40 stable cells with inhibitors. Upper panel shows quantification of invasion experiments (200× magnification); lower panel shows representative images. Results are presented as the relative number of invading cells in five randomly selected fields. Error bars represent mean ± standard error (SE); n = 3. Unpaired t‐test was performed. *P < 0.05, ***P < 0.001. (E) Protein levels were confirmed by immunoblotting after treatment of DMSO and 0.5 and 1 μm of Compound C in 6045_SV40 stable cell lines, with α‐actinin as an internal loading control. (F) Cell proliferation was measured via crystal violet assay after treatment of DMSO and 0.5 and 1 μm of Compound C in 6045_SV40 stable cells. Upper panel shows representative images; lower panel shows the relative absorbance at 595 nm. Error bars represent mean ± SE; n = 3 Unpaired t‐test was performed. *P < 0.05, **P < 0.01. (G) Protein expressions were detected by immunoblotting after transient transfection of siControl or siAMPK alpha1 in 6045_SV40 stable cells, with α‐actinin as an internal loading control. (H) Cell proliferation was measured via crystal violet assay after transient transfection of siControl or siAMPK alpha1 in 6045_SV40 stable cells. Upper panel shows representative images; lower panel shows the relative absorbance at 595 nm. Data are expressed as the mean ± SE; n = 3. Unpaired t‐test was performed. ***P < 0.001.
