Fig. 5.

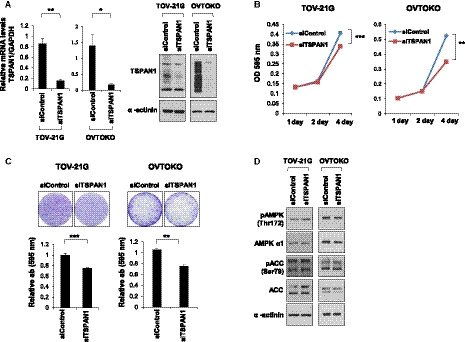
TSPAN1 knockdown decreases cell proliferation in OCCC cell lines. (A) TSPAN1 expression was detected by real‐time PCR (left panel) and immunoblotting (right panel) in TOV‐21G and OVTOKO cells, with α‐actinin as an internal loading control. Data are expressed as the mean ± standard error (SE); n = 3. Unpaired t‐test was performed. *P < 0.05, **P < 0.01. (B) Cell proliferation was determined via crystal violet staining at various times after transient transfection of siControl or siTSPAN1 in TOV‐21G and OVTOKO cells. Error bars represent mean ± SE; n = 3. Unpaired t‐test was performed. **P < 0.01, ***P < 0.001. (C) Colony forming assay was performed in TOV‐21G and OVTOKO cells. Upper panel shows representative images; lower panel shows the relative absorbance at 595 nm. Error bars represent mean ± SE; n = 3. Unpaired t‐test was performed. **P < 0.01, ***P < 0.001. (D) Protein expressions were detected using immunoblotting after transient transfection of siControl or siTSPAN1 in TOV‐21G and OVTOKO cells, with α‐actinin as an internal loading control.
