
Fig. 5.
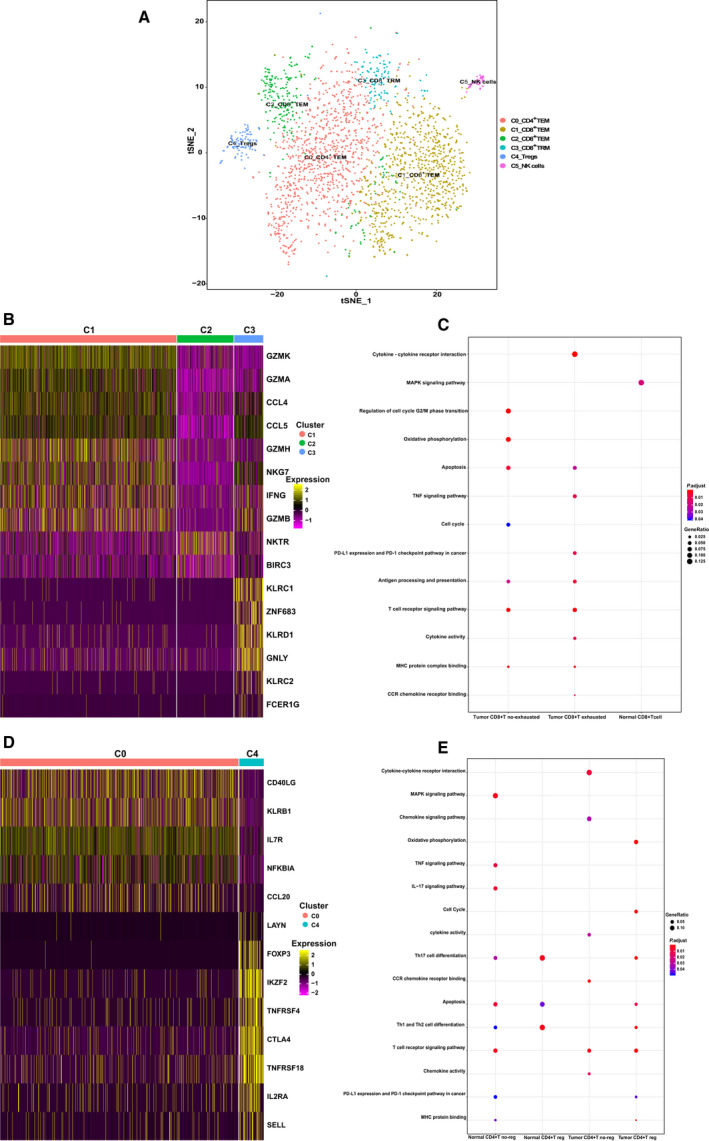
Heterogeneity of CD8+ and CD4+ T cells in normal tissue. (A) The t‐distributed stochastic neighbor embedding (t‐SNE) projection of T cells from adjacent normal tissue of patients with OSCC, showing the formation of six main clusters in different colors. The functional description of each cluster is determined by the gene expression characteristics. Cluster 0: C0_CD4+ TEM; Cluster 1: C1_CD8+ TEM; Cluster 2: C2_CD8+ TEM; Cluster 3: C3_CD8+ TRM; Cluster 4: C4_Tregs; Cluster 5: C5_NK cells. (B) Heatmap of key genes expressed in normal tissue CD8+ T‐cell clusters with cells grouped by clusters. Columns correspond to the cells, and rows correspond to the genes. Yellow: high expression; purple: low expression. Selected key genes are shown on the right. (C) Gene ontology (GO) enrichment plots for CD8+ T cells in the tumor and adjacent normal tissue. (D) Heatmap of normal CD4+ T cells, with two main clusters identified, each containing a unique set of signature genes. Selected genes with high expression are shown on the right. Yellow: high expression; red: low expression. (E) GO enrichment plots for CD4+ T cells in the tumor and adjacent normal tissue.