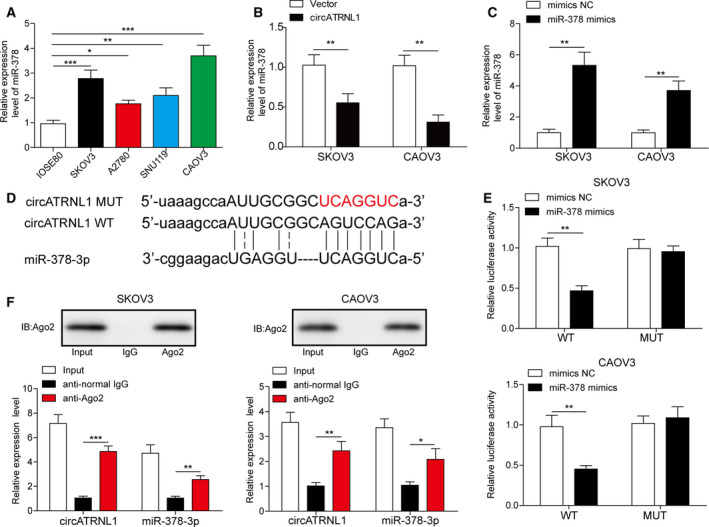
Fig. 2.

circATRNL1 directly bound to miR‐378. (A) qRT‐PCR analysis to measure miR‐378 levels in ovarian cancer cells. (B) qRT‐PCR analysis of miR‐378 level in cells transfected with circATRNL1 or vector. (C) qRT‐PCR analysis of miR‐378 level in transfected cells. Relative expression level of miR‐378 was normalized to U6. (D) The binding sites between circATRNL1 and miR‐378. (E) Relative luciferase activity of WT‐circATRNL1 and MUT‐circATRNL1 in cells transfected with mimics NC, miR‐378 mimics. (F) Ago2 antibody pulled down more circATRNL1 and miR‐378 compared to IgG control. All the results were shown as mean ± SD (n = 3), which were three separate experiments performed in triplicate. *P < 0.05, **P < 0.01, and ***P < 0.001.
