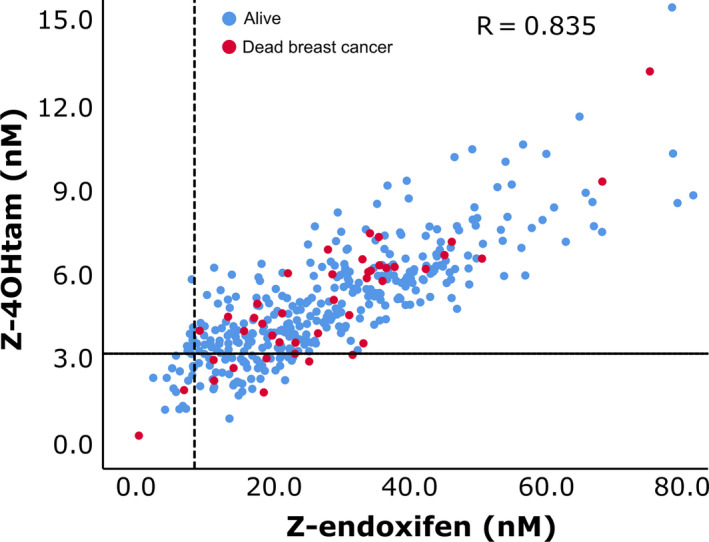
Fig. 2.

Distribution of Z‐endoxifen and Z‐4OHtam concentrations according to thresholds. Patients are from main cohort (n = 406). Reference lines on y‐axis and x‐axis represent 3.26 nm Z‐4OHtam (horizontal line) and 9.00 nm endoxifen thresholds (vertical line), respectively. Red circles represent patients dead of BC, and blue circles represent patients alive or dead of other causes.
