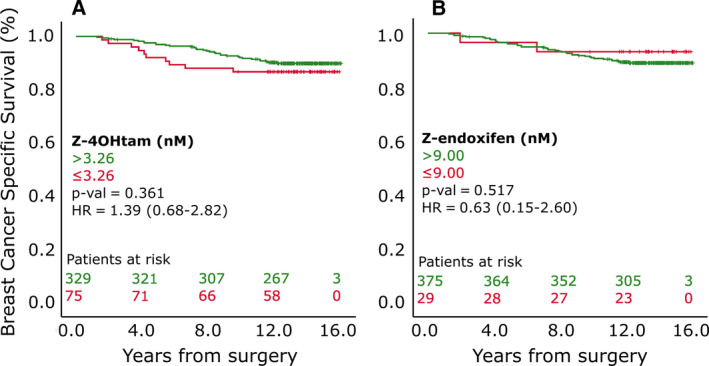
Fig. 3.

BCSS according to active metabolite thresholds in 406 patients. Panels A and B represent patients grouped according to Z‐4OHtam and Z‐endoxifen thresholds, respectively, in all patients included (n = 406). Log‐rank tests were used to determine differences in BCSS between groups. Patients at risk are shown according to color coding.
