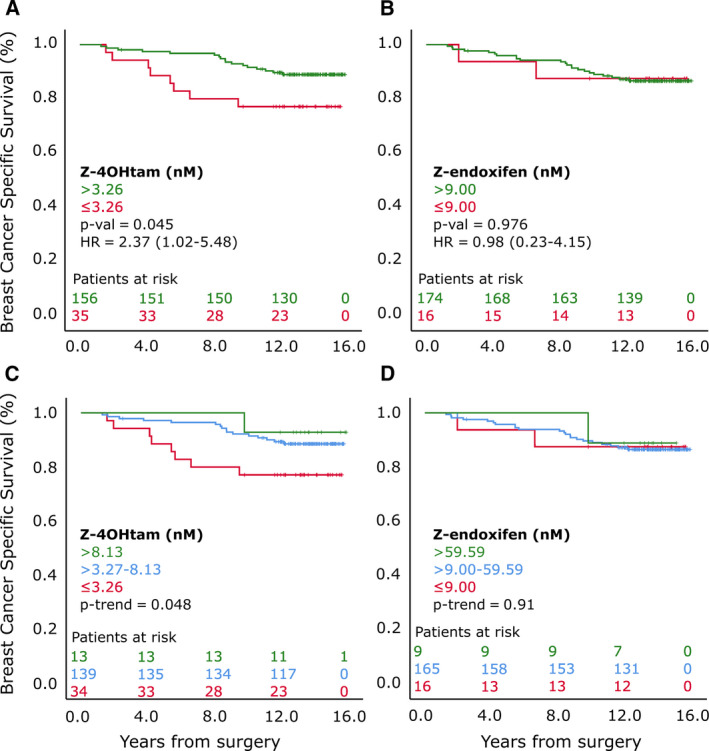
Fig. 4.

BCSS according to active metabolite thresholds in ‘tamoxifen‐only’ subgroup. Panels A and B represent patients grouped according to Z‐4OHtam and Z‐endoxifen thresholds, respectively, in ‘tamoxifen‐only’ subgroup (n = 191). C and D are patients grouped according to ordinal Z‐4OHtam and Z‐endoxifen levels, respectively, in ‘tamoxifen‐only’ subgroup. Log‐rank tests were used to determine differences in BCSS between groups. Patients at risk are shown according to color coding.
