Fig. 4.

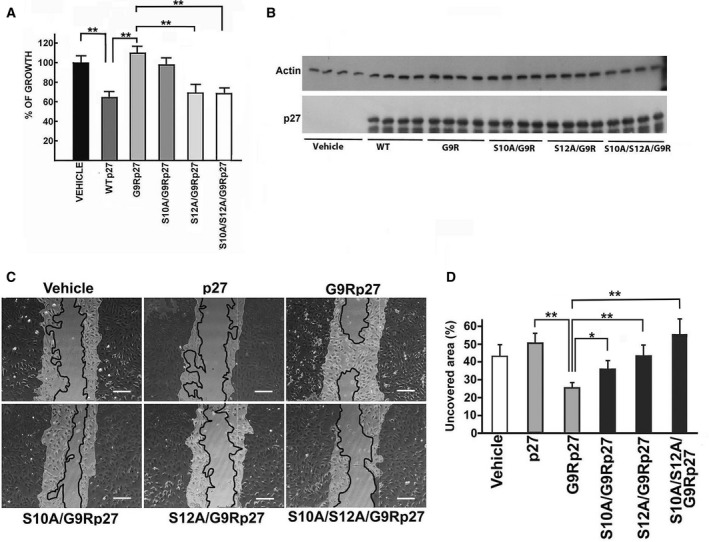
Effect of S12 phosphorylation on the phenotypic activities of G9R‐p27. (A) MEF cells were transfected with different pcDNA3.0 plasmids, namely empty plasmid (indicated as VEHICLE) and plasmids encoding p27 (WTp27), G9R‐p27, S10A/G9R‐p27, S12A/G9R‐p27, and S10A/S12A/G9R‐p27. After 72‐h transfection, the cell number in each well was determined by direct cell counting. Each value is the mean of four independent transfections; bars represent standard deviation. Data were analyzed by Student's t‐test. **P < 0.01. (B) MEFs from experiments described in Panel A were used to prepare cell extracts. These extracts were analyzed by WB using anti‐p27 mAb for evaluating p27, G9R‐p27, and its derivatives’ content in the transfected cells. Actin was determined as loading control. (C) The panel shows representative images of a wound‐healing experiment. LN‐229 cells were transfected with the empty pcDNA3.0 vector (Vehicle), and different plasmids as reported in the figure. The darker areas outline the initial wound border, while the continuous line the migration front. Scale bar corresponds to 50 µm. (D) The plot reports the quantitation of the wound‐healing experiment showed in C. Columns represent the percentage of uncovered area by each cell population after 24 h of wound healing (with respect of the uncovered area at time 0), calculated by imagej analysis of the images. Error bars represent the standard deviation of the mean of three independent experiments. Data were analyzed by Student's t‐test. *P < 0.05; **P < 0.01.
