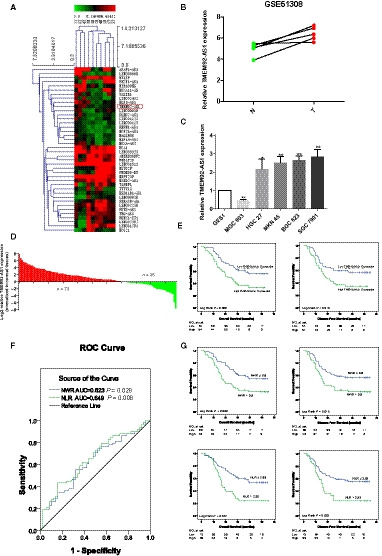
Fig. 1.

Expression of TMEM92‐AS1 in GC tissues and its clinical significance. (A) Screening TMEM92‐AS1 by bioinformatics analysis. (B) The expression of TMEM92‐AS1 in five pairs of GC tissues and adjacent normal tissues in GEO database. (C) The expression of TMEM92‐AS1 in several GC cell lines; error bars indicate SD. (D) TMEM92‐AS1 was detected in 108 pairs of GC tissues. (E) Patients with high levels of TMEM92‐AS1 expression (n = 54) showed reduced OS and DFS compared with patients with low TMEM92‐AS1 expression (n = 54) by log‐rang test. (F) Optimal cut‐off values for NWR and NLR were applied with ROC curves. (G) Patients with high NWR (n = 48) and NLR (n = 75) showed reduced OS and DFS compared with patients with low NWR (n = 60) and NLR (n = 33) by log‐rank test.
