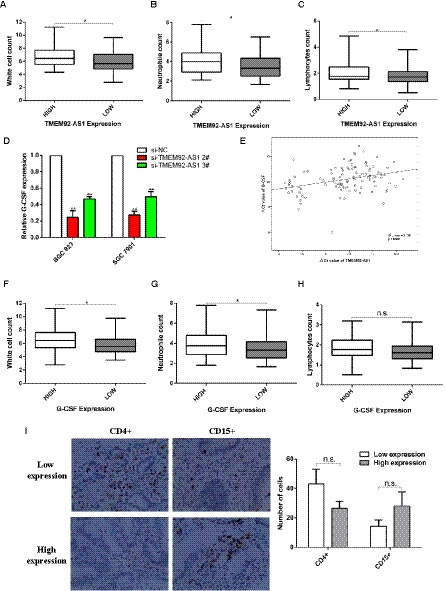
Fig. 6.

Relationships between TMEM92‐AS1 and G‐CSF expression levels with leucocyte counts. (A–C) Relationships between TMEM92‐AS1 expression and white cell, neutrophil and lymphocyte counts (n = 108). (D) Expression levels of G‐CSF after TMEM92‐AS1 knockdown in BGC823 and SGC7901 cells. (E) The level of TMEM92‐AS1 in GC tissues was significantly correlated with that of G‐CSF (n = 108); (F–H) Relationships between G‐CSF expression and white cell, neutrophil and lymphocyte counts (n = 108). (I) Comparison of infiltrating CD4+ lymphocytes and CD15+ neutrophils in GC tissues in different patients (n = 20, scale bar: 100 μm). *P < 0.05, n.s. = not significant by Student’s t‐test. For all of these experiments, values were mean ± SD (error bars) of triplicate samples in representative experiments.
