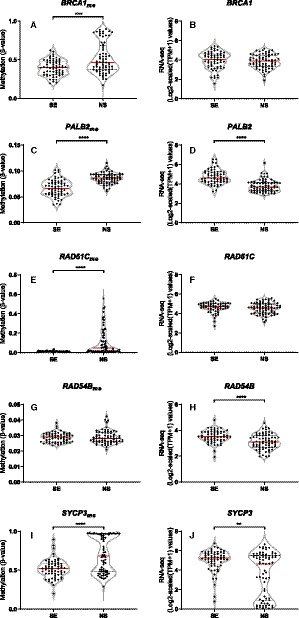
Fig. 2.

Methylation and expression levels of target genes. BRCA1 (A, B), PALB2 (C, D), RAD51C (E, F), RAD54B (G, H), and SYCP3 (I, J) methylation/expression levels among seminomas and nonseminomas. Methylation levels are reported as beta‐values (450k array) and gene expression as Log2‐scaled (TPM + 1) (RNA‐sequencing) values. Error bars indicate median and interquartile range. Statistical test was Mann–Whitney. Analyses include n = 63 seminomas and n = 70 nonseminomas. See text for details. SE, seminoma; NS, nonseminoma; TPM, transcript per million.
