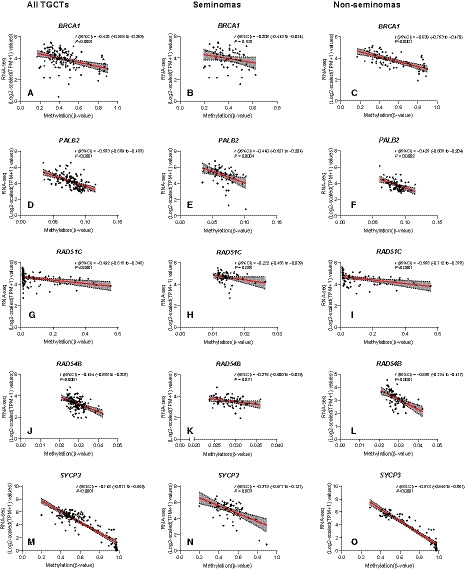
Fig. 3.

Expression‐methylation anti‐correlation analyses. Anti‐correlation analyses for BRCA1 (A–C), PALB2 (D–F), RAD51C (G–I), RAD54B (J–L), and SYCP3 (M–O) in all testicular germ cell tumors, and individually for seminomas and nonseminomas. The aggregation of significant CpG sites identified is considered. Methylation levels are reported as beta‐values (450k array) and gene expression as Log2‐scaled (TPM + 1) (RNA‐sequencing) values. The line was modeled through simple linear regression, and the statistical test was Spearman correlation test. Shaded gray area relates to error, set to 95% confidence. Analyses include n = 133 TGCTs (n = 63 seminomas and n = 70 nonseminomas). See text for details. TGCTs, testicular germ cell tumors; TPM, transcript per million.
