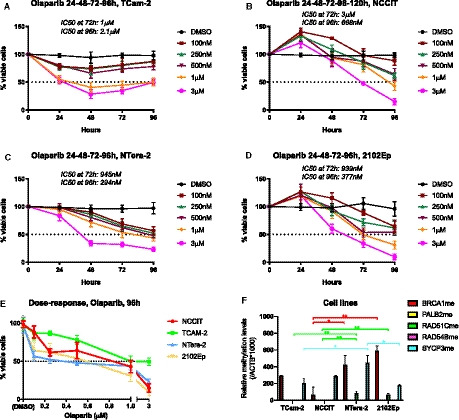
Fig. 5.

Sensitivity to Olaparib in TGCT cell lines in respect to methylation of target genes. (A–D) Cell viability curves for TCam‐2, NCCIT, NTera‐2, and 2102Ep; (E) combined dose‐response curves for all four cell lines; (F) differential methylation levels of selected target genes among the different cell lines. Results are normalized to ACTB. Error bars indicate mean and standard deviation. Statistical test was Kruskal–Wallis with Dunn's test for multiple comparisons. Three biological replicates were included in Olaparib viability experiment, and five biological replicates in qMSP, both with experimental triplicates.
