
Fig. 6.
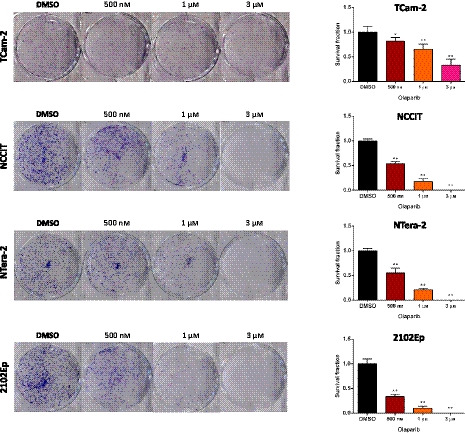
Colony formation assay in all four cell lines upon treatment with Olaparib. Photographs of the effect on colony number and graphical representation of survival fraction upon treatment with Olaparib, compared to control condition, for (A) TCam‐2, (B) NCCIT, (C) NTera‐2, and (D) 2102Ep. Error bars indicate mean and standard deviation. Statistical test was Kruskal–Wallis with Dunn's test for multiple comparisons. Six biological replicates were included.