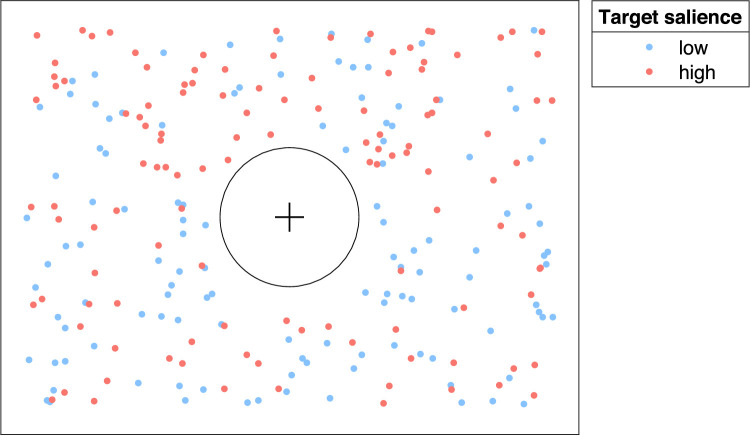
Figure B1.
Positions of search targets in the 120 scenes used in Experiments 1 and 2. The light blue dots represent the positions of the low-salience targets, whereas the salmon dots represent the positions of the high-salience targets. The cross is the central fixation cross, and the circle with solid perimeter represents the central viewing area (radius 3°).

