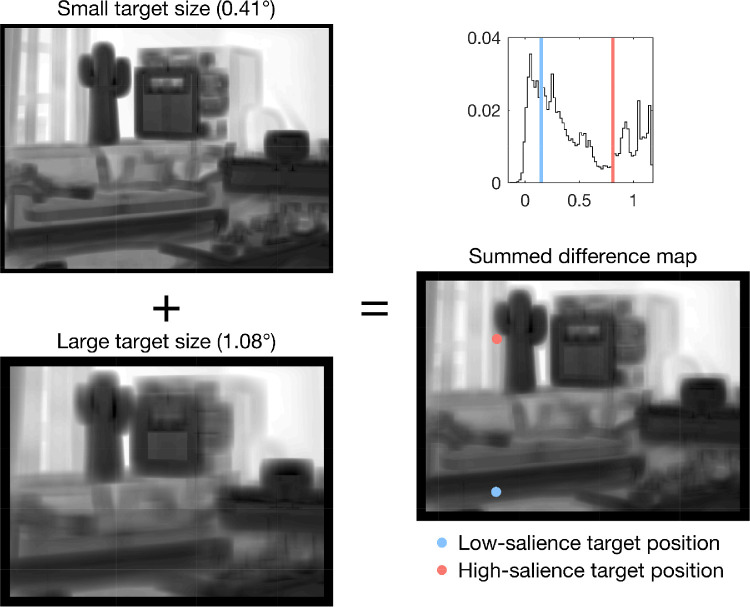
Figure 2.
Algorithmic target placement at low and high salient regions within the scene. Left: Contrast difference maps for the small and large target size used in Experiment 1, for the example scene used in Figure 1 and Figure 7. Right: Summed contrast difference map (bottom) and the distribution of the map's values (top). Two vertical lines were added to the histogram to mark the lower (light blue) and upper (salmon) quartiles of the distribution. These values were used to determine suitable positions for low- and high-salience targets in the scene image. For the example image, the final target positions are marked with colored dots in the summed contrast difference map. For visualization purposes, the values of a given map were scaled to the same range (i.e., to [0,1]).

