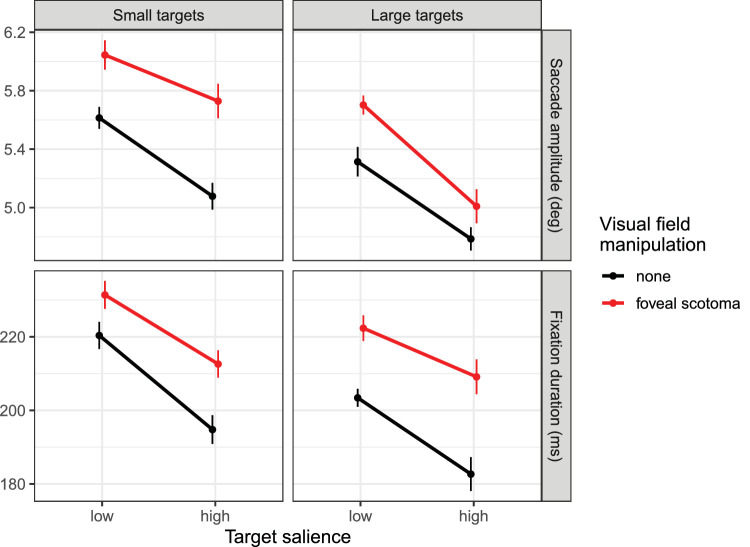
Figure 6.
Mean saccade amplitudes (top row) and fixation durations (bottom row) for small targets (left column) as opposed to large targets (right column) in Experiment 1. In each panel, data are presented for low- and high-salience targets during visual search with or without a simulated foveal scotoma. Error bars are within-subjects standard errors.

