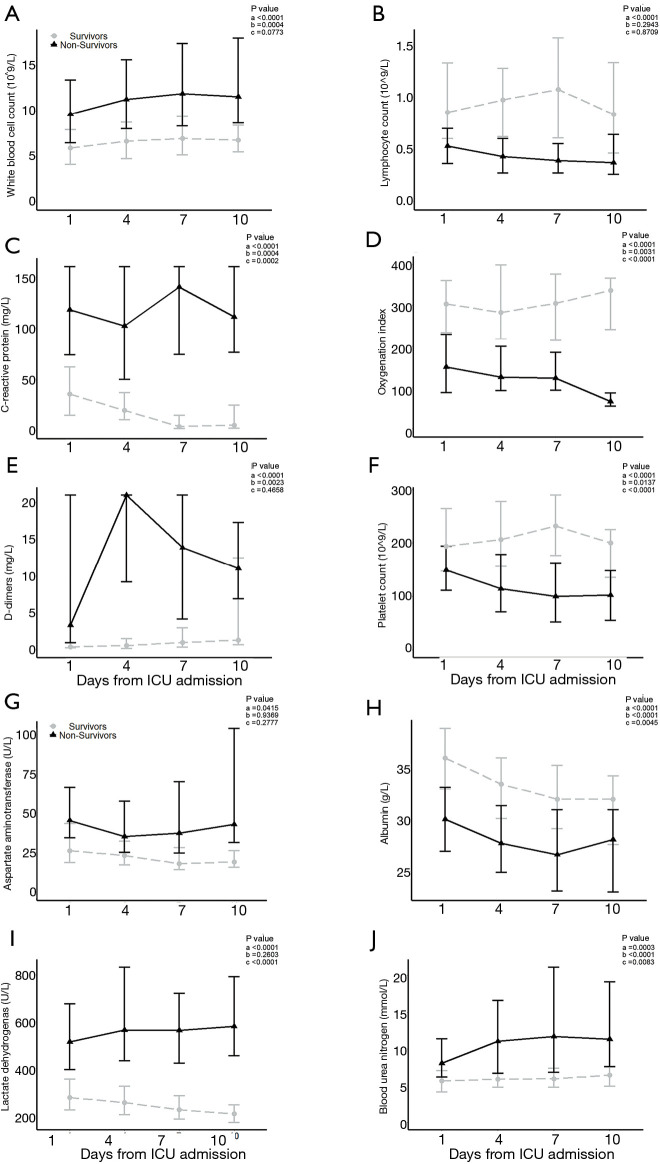
Figure 1.
Laboratory findings of 93 survivors with COVID-19 in Wuhan, China on days 1, 4, 7, and 10. Line chart shows temporal changes in white blood cell count (A), lymphocyte count (B), C-reactive protein (C), oxygenation index (D), D-dimer (E), platelet count (F), aspartate aminotransferase (G), albumin (H), lactate dehydrogenase (I) and blood urea nitrogen (J). All points were presented as median (interquartile ranges). Differences between non-survivors and survivors were compared using mixed linear model. Legend of P values shows P values of group (a), P values of time (b) and P values of interaction between group and time (c).

