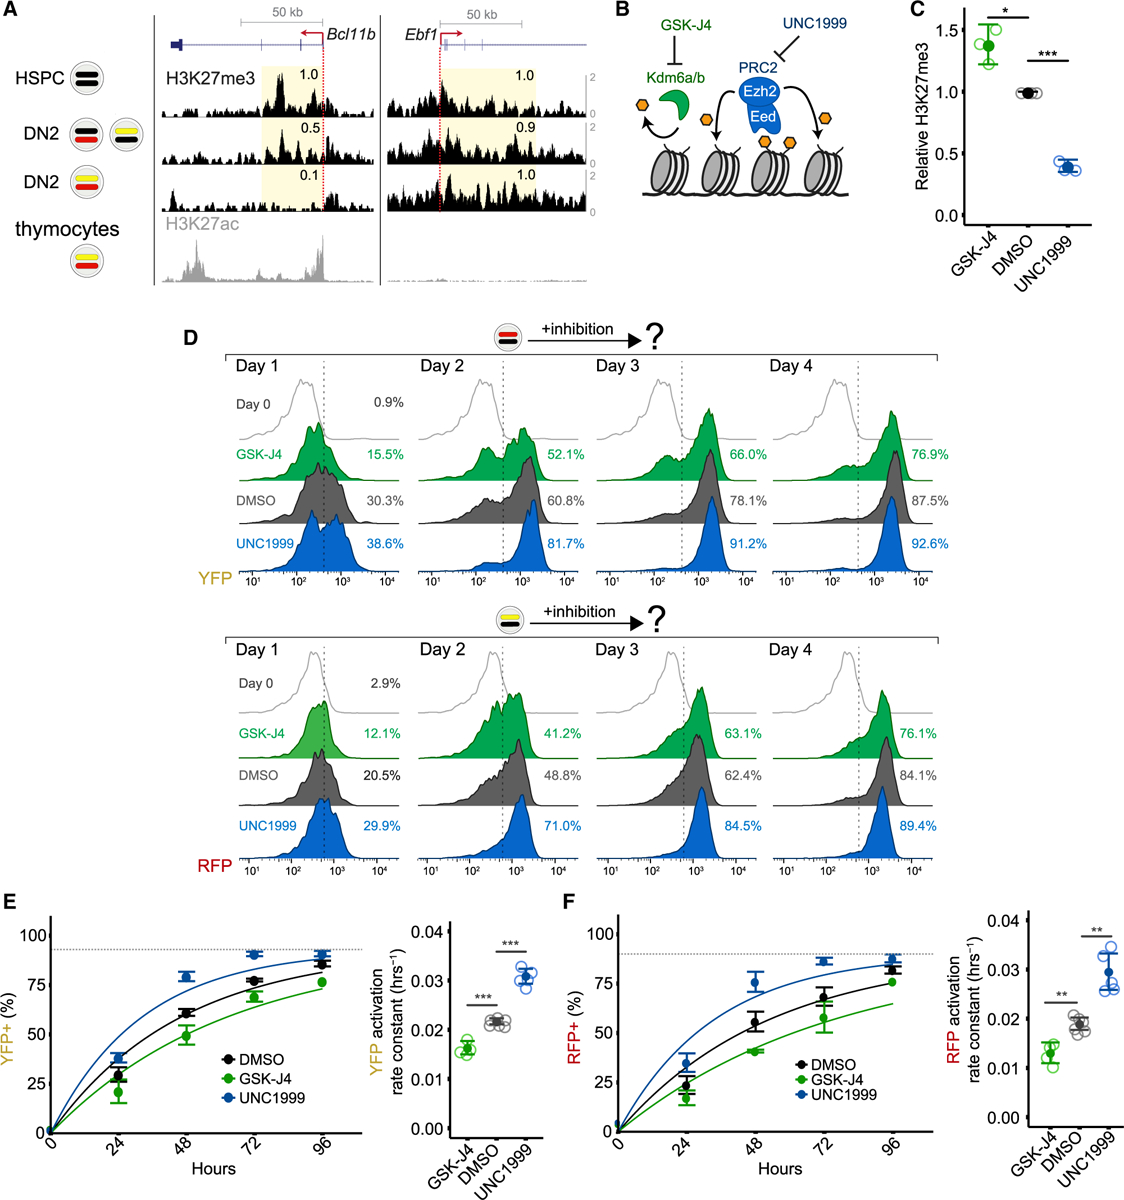
Figure 2. H3K27me3 levels, set by PRC2 and Kdm6a/b demethylases, modulate Bcl11b activation timing.

(A) H3K27me3 distributions were profiled by CUT&RUN in Lin− bone marrow progenitors (hematopoietic stem and progenitor cells [HSPCs]), as well as purified DN2 monoallelic and biallelic Bcl11b-expressing cells with UCSC Genome Browser tracks showing H3K27me3 densities at Bcl11b, as well as at Ebf1, a B cell regulator that is repressed during T cell development. Relative read densities of shaded areas are shown. H3K27ac levels in thymocytes, obtained from ENCODE accession number ENCSR000CCH (Davis et al., 2018), demarcate transcribed region. Data are representative of two independent experiments.
(B) Schematic depicting inhibition of H3K27 demethylases Kdm6a/b or H3K27 methyltransferase PRC2.
(C) DN2 monoallelic progenitors treated with the indicated inhibitors were sorted for anti-H3K27me3 CUT&RUN followed by qPCR at the Bcl11b promoter. Mean values are shown for n = 3 independent experiments (two-sample t test, one-tailed: *p < 0.05; ***p < 0.001).
(D) Purified DN2 monoallelic expressing cells were re-cultured with the indicated inhibitors and analyzed by flow cytometry. Histograms show results from one representative experiment.
(E and F) (Left) Mean activation percentages and 95% confidence intervals are plotted with curves representing fits to the equation y = F(1 − e−kt), where F = maximum percentage of cells positive for assayed allele (represented by the dotted gray lines). (Right) Data represent mean rate constants, k, with 95% confidence intervals (two-sample t test, one-tailed: **p < 0.01; ***p < 0.001; n = 4–6 independent experiments).
See also Figure S1.
