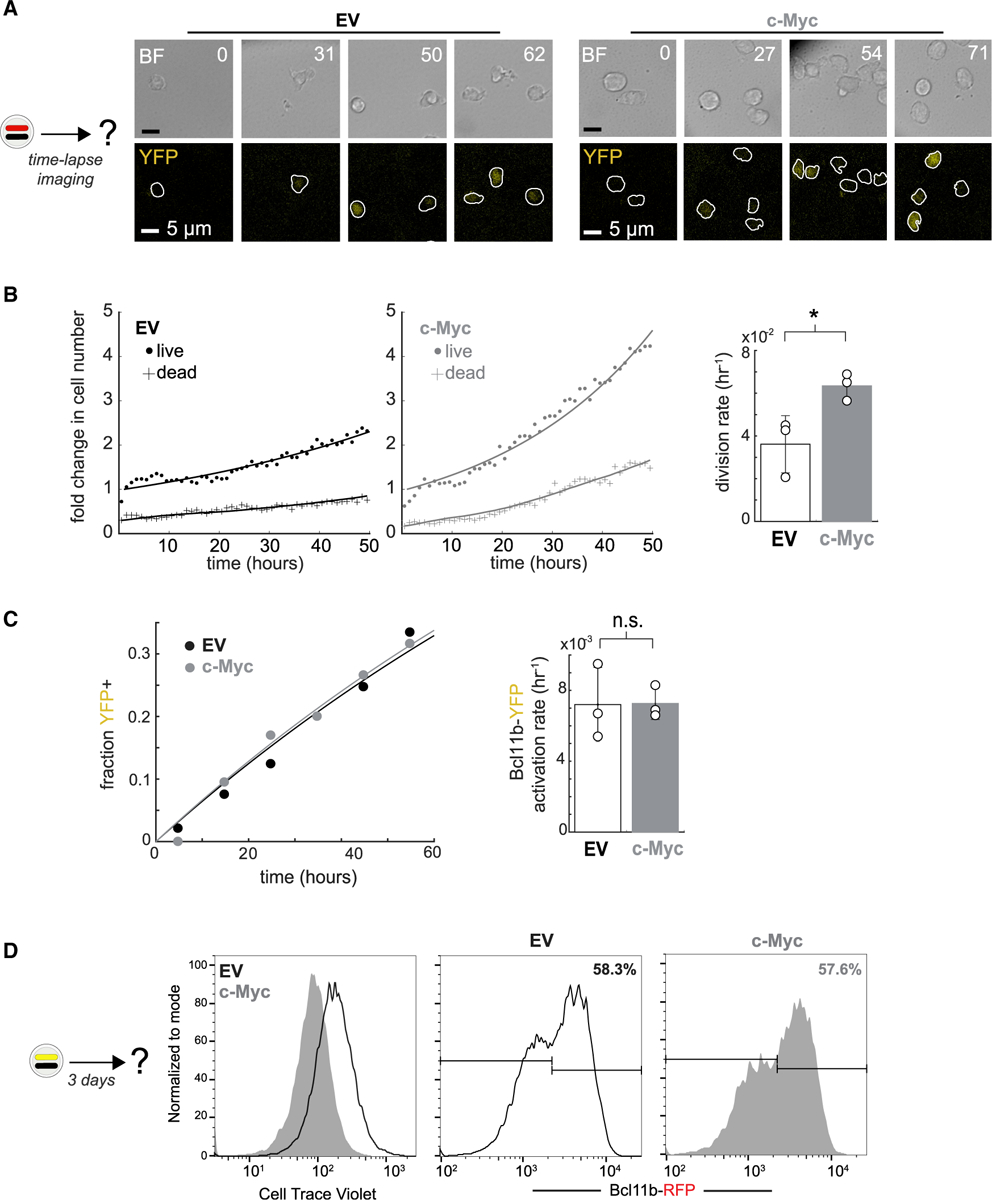
Figure 3. Bcl11b activation timing is independent of cell-division speed.

Bcl11bYFP−/RFP+ DN2 progenitors transduced with either an empty vector (EV) or c-Myc overexpressing retroviral vector were purified, re-cultured on DL1-coated plates, and monitored by time-lapse imaging.
(A) Time-lapse images. White boundaries show automated cell segmentation. Numbers show elapsed time in hours.
(B) (Left) Time evolution of live and dead cell numbers. Data were fitted to a population dynamics model as shown in Figure S2. (Right) Data represent mean and standard deviation of cell division rates for n = 3 independent experiments (paired two-sample t test, one-tailed; *p < 0.025).
(C) (Left) Fraction of YFP+ cells over time. (Right) Data represent mean and standard deviation of Bcl11b-YFP activation rates for n = 3 independent experiments (paired two-sample t test, one-tailed; n.s., not significant).
(D) Bcl11bRFP+/YFP− DN2 progenitors transduced with either EV or c-Myc were re-cultured on OP9-DL1 stromal monolayers for 3 days before analyzing by flow cytometry.
