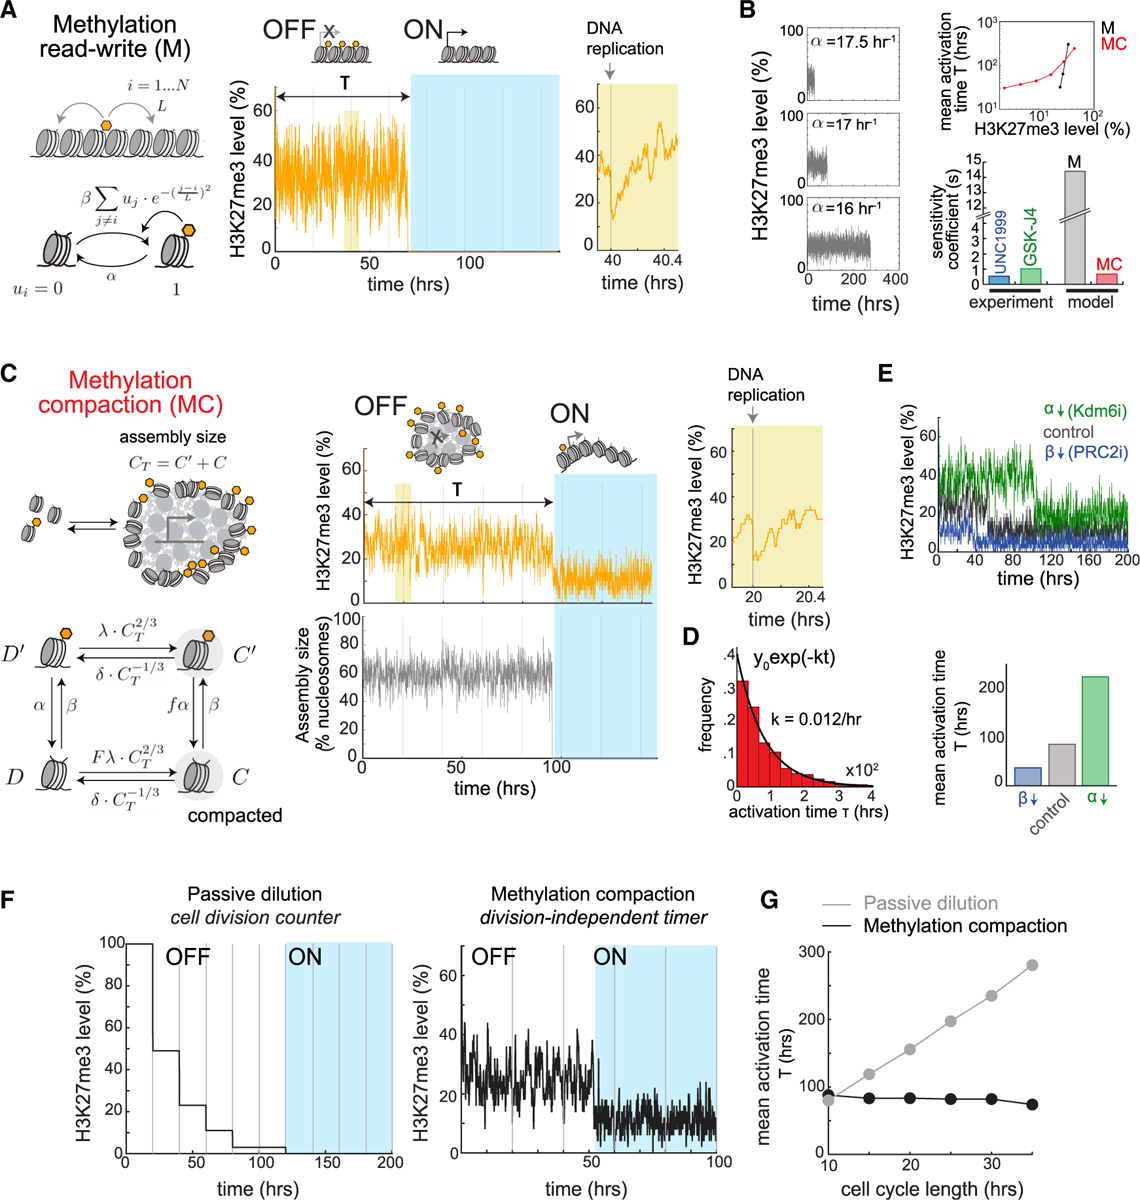
Figure 4. A methylation-compaction switching mechanism generates tunable, division-independent delays in gene activation.

(A) Methylation read-write (M) model (left), along with representative simulation (right).
(B) Representative simulations of M model with different demethylation rates α (left). Mean activation times against H3K27me3 levels (top right) and sensitivity coefficients for this relationship (bottom right) are shown.
(C) Methylation compaction (MC) model (left), along with representative simulation (right).
(D) Histogram shows distribution of activation times, along with exponential fit.
(E) Representative simulations of MC model, simulating PRC2 or Kdm6a/b inhibition (top), along with mean activation times (bottom).
(F) Simulations of passive dilution and MC models. Vertical lines indicate DNA replication events.
(G) Mean activation times as a function of cell cycle length.
See also Figures S3–S7.
