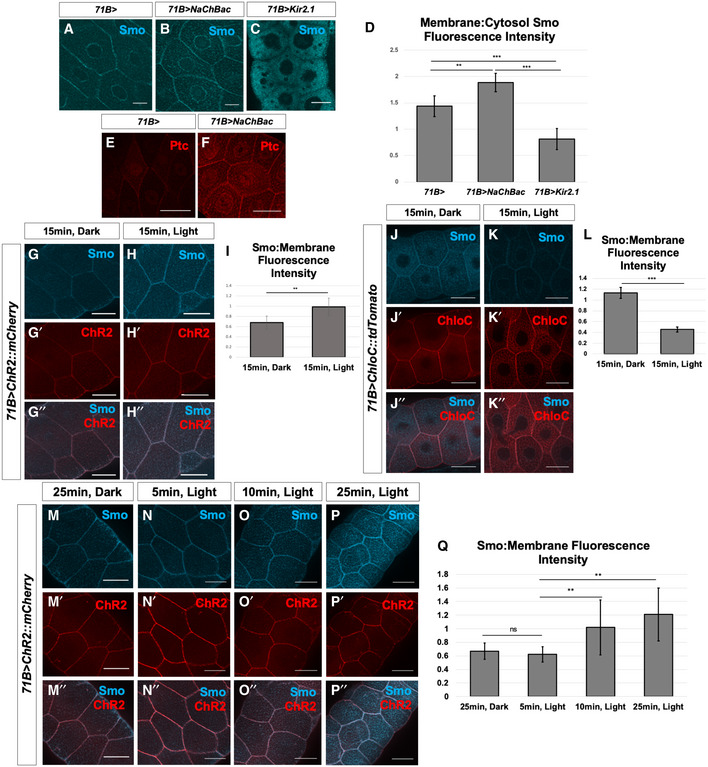
A–QManipulation of Vmem in salivary glands dissected from third‐instar larvae. (A–C) Localization of Smo protein (blue) following expression of 71B‐Gal4 (A), 71B‐Gal4 and UAS‐NaChBac (B) or 71B‐Gal4 and UAS‐Kir2.1 (C). Expression of the sodium channel NaChBac increases membrane localization of Smo while expression of the potassium channel Kir2.1 reduces membrane localization and increases cytosolic Smo (B, C). (D) Quantification of the ratio of membrane Smo fluorescence to cytosol fluorescence. N = 7 salivary glands per genotype. Data were compared using ANOVA followed by Tukey′s test for significance (** indicates P < 0.01, *** indicates P < 0.001), error bars are standard deviations. (E, F) Expression of the Hh target gene ptc is visualized using anti‐Ptc immunostaining. Compared to 71B‐Gal4 (E), Ptc expression is increased in glands expressing 71B‐Gal4 and UAS‐NaChBac (F). (G‐I) Effect of expression and activation of the depolarizing channelrhodopsin ChR2 on Smo protein membrane abundance. After dissection, glands were kept in either dark conditions (G) or exposed to 15 min of blue light (H). (I) Quantification of membrane fluorescence; N = 13 glands, data compared using an unpaired t‐test (** indicates P < 0.01), error bars are standard deviations. (J–L) Effect of expression and activation of the Cl−‐selective channelrhodopsin ChloC. An overall reduction in Smo immunostaining was observed following channel activation (K), as compared to control glands kept in the dark (J). (L) Quantification of membrane fluorescence; N = 10 glands, data were compared using an unpaired t‐test (*** indicates P < 0.001), error bars are standard deviations. (M–Q) Time course of change in Smo localization. Salivary glands expressing the channelrhodopsin ChR2 were subjected to increasing intervals of activating light, then fixed and stained for Smo protein (M–P″). (Q) Quantification of membrane‐associated fluorescence; N = 7 glands/timepoint, data were compared using ANOVA followed by Tukey′s test for significance (** indicates P < 0.01), error bars are standard deviations. Scale bars are 50 µm, except for (A–C), where scale bars are 25 µm.

