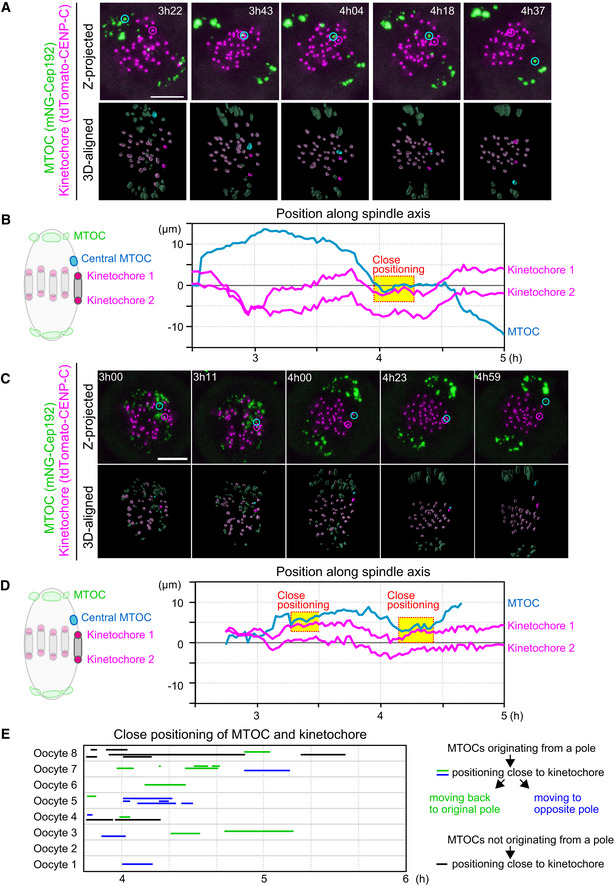
Figure EV2. Central MTOCs can be positioned close to kinetochores.

- Live imaging of MTOC and kinetochore dynamics. Z‐projected and 3D‐reconstructed images for MTOCs (mNG‐Cep192, green) and kinetochores (tdTomato‐CENP‐C, magenta) are shown. The 3D‐reconstructed images are aligned based on the spindle axis, with highlights on an MTOC and a pair of kinetochores. Time in h:mm after NEBD. Scale bar, 10 μm. Cyan circles follow an MTOC in the middle of the spindle. Magenta circles follow a kinetochore that transiently positions close to the MTOC.
- Tracking of MTOCs and kinetochores. The positions of MTOCs (cyan) and kinetochores (magenta), which are highlighted in (A), along the spindle axis are shown over time. Time after NEBD. Dotted boxes represent periods when the kinetochore‐MTOC distance was < 2 μm.
- Another example of the image dataset acquired from the experiment shown in (A). Images are presented as in (A).
- The dataset shown in (C) was analyzed and presented as in (B).
- Close positioning of MTOCs and kinetochores is frequently observed. Lines indicate periods when oocytes exhibited close positioning of MTOCs and kinetochores (< 2 μm). We categorized kinetochore‐proximal MTOCs into three groups: (1) MTOCs that originated from a pole, positioned close to a kinetochore, and then moved back to the original spindle pole (green), (2) MTOCs that originated from a pole, positioned close to a kinetochore, and then moved to the opposite spindle pole (blue) and, (3) MTOCs that did not originate from spindle poles and are positioned close to the kinetochore (black).
Data information: See also Movies EV3 and EV4.
Source data are available online for this figure.
