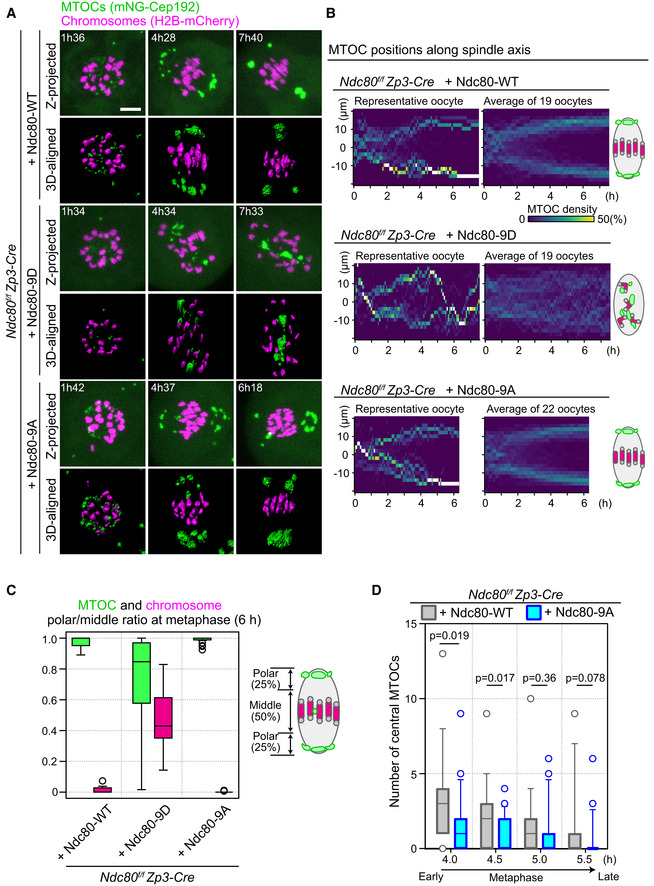
Figure 3. Kinetochore–microtubule attachment stability is required to confine MTOCs at spindle poles.

- Live imaging of Zp3‐Cre Ndc80f/f oocytes injected with Ndc80‐WT, Ndc80‐9D, or Ndc80‐9A. Z‐projection and 3D‐reconstructed images show MTOCs (mNeonGreen‐Cep192, green) and chromosomes (H2B‐mCherry, magenta). Time in h:mm after NEBD. Scale bar, 10 μm.
- Ndc80‐9D is defective for MTOC sorting. The density map of MTOCs along the spindle axis in Zp3‐Cre Ndc80f/f oocytes expressing Ndc80‐WT, Ndc80‐9D, or Ndc80‐9A. The color represents the percentage of MTOC volume coded from dark (0%) to white (50% or more of the total volume).
- MTOCs do not accumulate at the spindle poles in Ndc80‐9D‐expressing oocytes. Ratio of MTOCs (green) or chromosomes (magenta) in the polar region versus those in the middle region of the spindle at 6 hours after NEBD (n = 19, 19, and 22 oocytes, respectively, from at least three independent experiments). Boxes show 25–75 percentiles, and whiskers encompass data points within 1.5 times the interquartile range.
- Ndc80‐9A decreases central MTOCs. The number of central MTOCs (MTOCs that were positioned in the middle region of the spindle as shown in (C)) was determined at each time point (n = 19, 21 oocytes, respectively, from at least 3 independent experiments). Two‐tailed Student’s t‐test was performed. Boxes and whiskers show 25–75 and 10–90 percentiles, respectively.
Data information: See also Movies EV6 and EV7.
Source data are available online for this figure.
