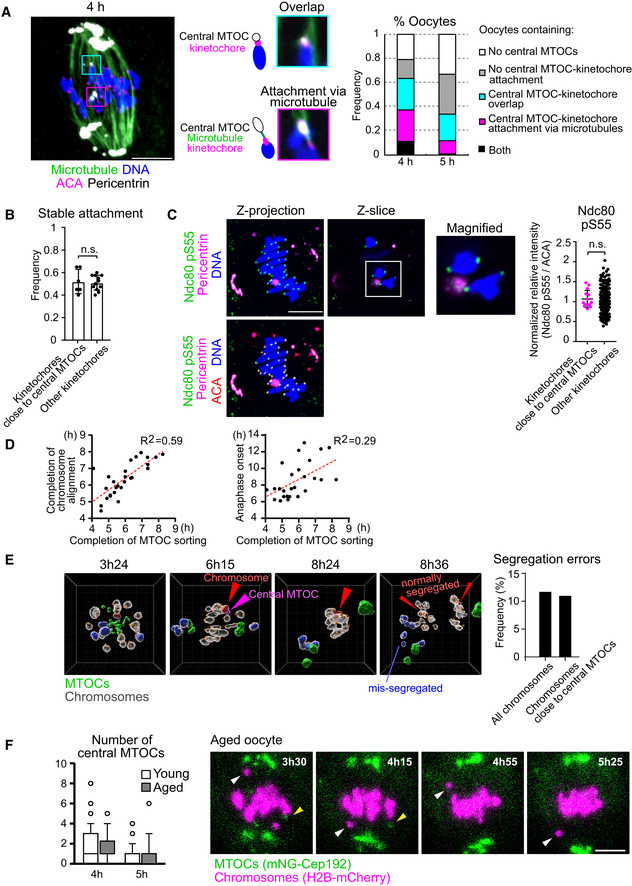
Figure EV3. Relationship between central MTOCs and kinetochores.

- Central MTOCs can attach to kinetochores. Oocytes at 4 h and 5 h after NEBD were treated with a cold buffer for 5 min before fixation. Cold‐stable microtubules were visualized by immunostaining oocytes for microtubules (α‐tubulin, green), kinetochores (ACA, magenta), pericentrin (gray) and chromosomes (Hoechst33342, blue). Z‐projection images and magnified z‐slices are shown. The frequency of oocytes containing central MTOC–kinetochore attachment and/or overlap is shown (n = 19, 18 oocytes from three independent experiments). Scale bar, 10 μm.
- Close positioning of central MTOCs does not affect stable kinetochore–microtubule attachment. Kinetochores were categorized into two groups: (1) ones that were positioned close to central MTOCs (< 1 μm) and (2) others. The frequency of stable end‐on microtubule attachment on each category is shown (n = 12, 6 oocytes from three independent experiments). Mean ± SD are shown. n.s., not significant by two‐tailed Student’s t‐test.
- Close positioning of central MTOCs does not affect phosphorylated Ser55 of Ndc80. Kinetochores were categorized into two groups: (1) ones that positioned close to central MTOCs (< 1 μm) and (2) others. Relative intensities of phospho‐Ser55 to ACA signals were calculated (n = 266, 14 kinetochores of 7 oocytes from three independent experiments). Mean ± SD are shown. n.s., not significant by two‐tailed Student’s t‐test. Scale bar, 10 μm.
- Temporal correlation of MTOC sorting with chromosome alignment and anaphase onset. Oocytes expressing mNG‐Cep192 and H2B‐SNAP labeled with SNAP‐Cell 647‐SiR or H2B‐mCherry were monitored by live imaging (n = 27 from seven independent experiments). The timings of the removal of all central MTOCs, chromosome alignment, and anaphase onset were determined. Correlation coefficients are shown. Time after NEBD (h).
- Close positioning of central MTOCs and chromosomes does not predict chromosome segregation errors. Oocytes expressing H2B‐SNAP labeled with SNAP‐Cell 647‐SiR (chromosomes), tdTomato‐CENP‐C (kinetochores), and mNG‐Cep192 (MTOCs) were cultured in the presence of 60 nM nocodazole and monitored by live imaging. Images were reconstructed in 3D. MTOCs are shown in green. A central MTOC that transiently positioned close to a chromosome is shown in magenta. This chromosome (shown in red) underwent normal segregation at anaphase. Chromosomes that underwent segregation errors are shown in blue. Other chromosomes are shown in gray. Kinetochore positions are marked with orange spheres. The frequency of segregation errors are shown. All chromosomes (n = 760 chromosomes of 38 oocytes) and chromosomes that positioned close to central MTOCs (n = 9 from 8 oocytes). The unit of the grid is 5 μm. Time after NEBD (h:mm). See also Movie EV5.
- Central MTOCs do not predict chromosome segregation errors in aged oocytes. Oocytes were collected from young (2‐month‐old) and naturally aged mice (17–22 months old). Oocytes expressing mNG‐Cep192 and H2B‐mCherry were monitored by live imaging. The number of central MTOCs was determined at 4 and 5 h after NEBD (n = 40, 22 from three independent experiments). Boxes and whiskers show 25–75 and 10–90 percentiles, respectively. Images for a representative aged oocyte exhibiting prematurely separated chromosomes (white arrowhead) are shown. Yellow arrowheads indicate central MTOCs. Time after NEBD (h:mm). Scale bar, 10 μm.
Source data are available online for this figure.
