
Figure 2. Kainic acid‐ and pilocarpine‐induced epileptic seizures in WT and Fxr2 KO mice.
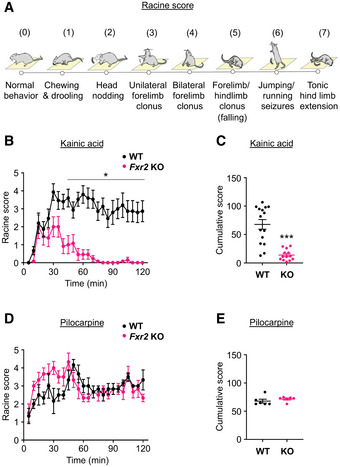
- The different stages of seizures based on increased severity.
- Average seizure score of KA‐treated WT and Fxr2 KO mice over time from t = 0 (injection time) to 2 h. *P < 0.05 compared with WT mice (two‐way Repeated Measures ANOVA; interaction effect of time and genotype; F 1,666 = 10.05, P = 0.0016; post hoc tests for indicated time points, P < 0.05). KA‐treated WT mice (n = 16), KA‐treated Fxr2 KO mice (n = 12). Data are presented as mean ± Standard Error of the Mean (SEM).
- Responsiveness to KA of WT (black, n = 16) and Fxr2 KO mice (magenta, n = 12). ***P < 0.001 compared with Fxr2 KO mice (two‐tailed Student's t‐test; t 26 = 5.72, P < 0.001). Data are presented as mean ± SEM.
- Average seizure score of pilocarpine‐treated WT and Fxr2 KO mice over time from t = 0 (injection time) to 2 h (two‐way Repeated Measures ANOVA, P = n.s.). Pilocarpine‐treated WT mice (n = 6), pilocarpine‐treated Fxr2 KO mice (n = 6). Data are presented as mean ± SEM.
- Responsiveness to pilocarpine (PC) of WT (n = 6) and Fxr2 KO mice (n = 6). (two‐tailed Student's t‐test, P = n.s.). Data are presented as mean ± SEM.