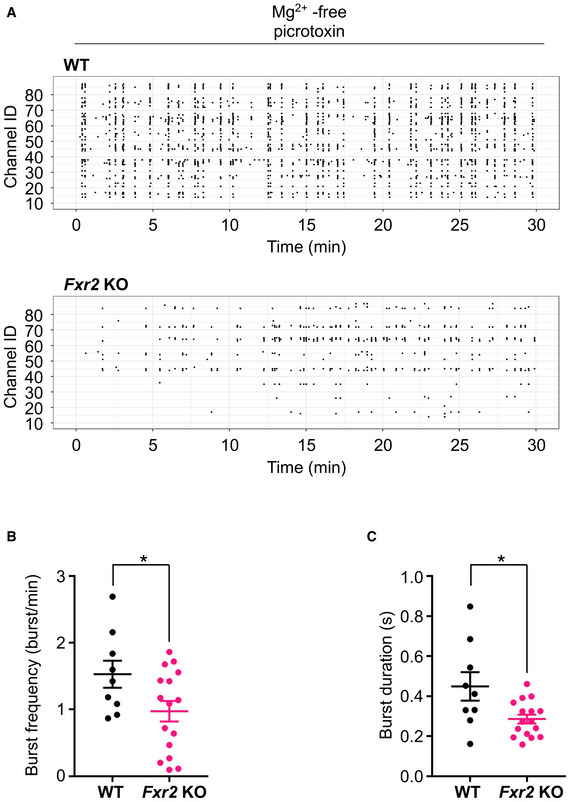
Figure EV3. Multi‐electrode array recording in WT and Fxr2 KO hippocampi.

-
ARepresentative rasterplot showing burst activity from a WT (top) and Fxr2 KO (bottom) hippocampal slice recorded in a multi‐electrode array (MEA) preparation.
-
B, CBurst frequency and burst duration. *P < 0.05, significant difference compared with WT slices. (n = 9 slices taken from 6 WT mice, 16 slices taken from 8 Fxr2 KO mice; two‐tailed Student's t‐test: burst frequency: t 23 = 2.17, P < 0.05; burst duration: t 23 = 2.71, P < 0.05). Data are presented as mean ± SEM.
