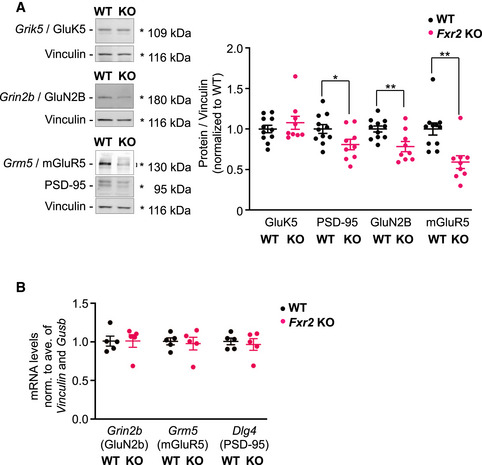
Representative Western blot and quantification of GluK5, PSD‐95, GluN2B, and mGluR5 proteins. Endogenous GluK5, PSD‐95, GluN2B, and mGluR5 in Fxr2 KO mice (n = 9) compared with WT mice (n = 11). *P < 0.05, **P < 0.01, significant difference between WT and Fxr2 KO (two‐tailed Student's t‐test: GluK5: t
18 = 0.87, P = 0.394; PSD‐95: t
18 = 2.29, P < 0.05; GluN2B: t
18 = 3.09, P < 0.01; mGluR5: t
18 = 3.74, P < 0.01). Quantified bands are highlighted with an asterisk or squared bracket. Data are presented as mean ± SEM.

