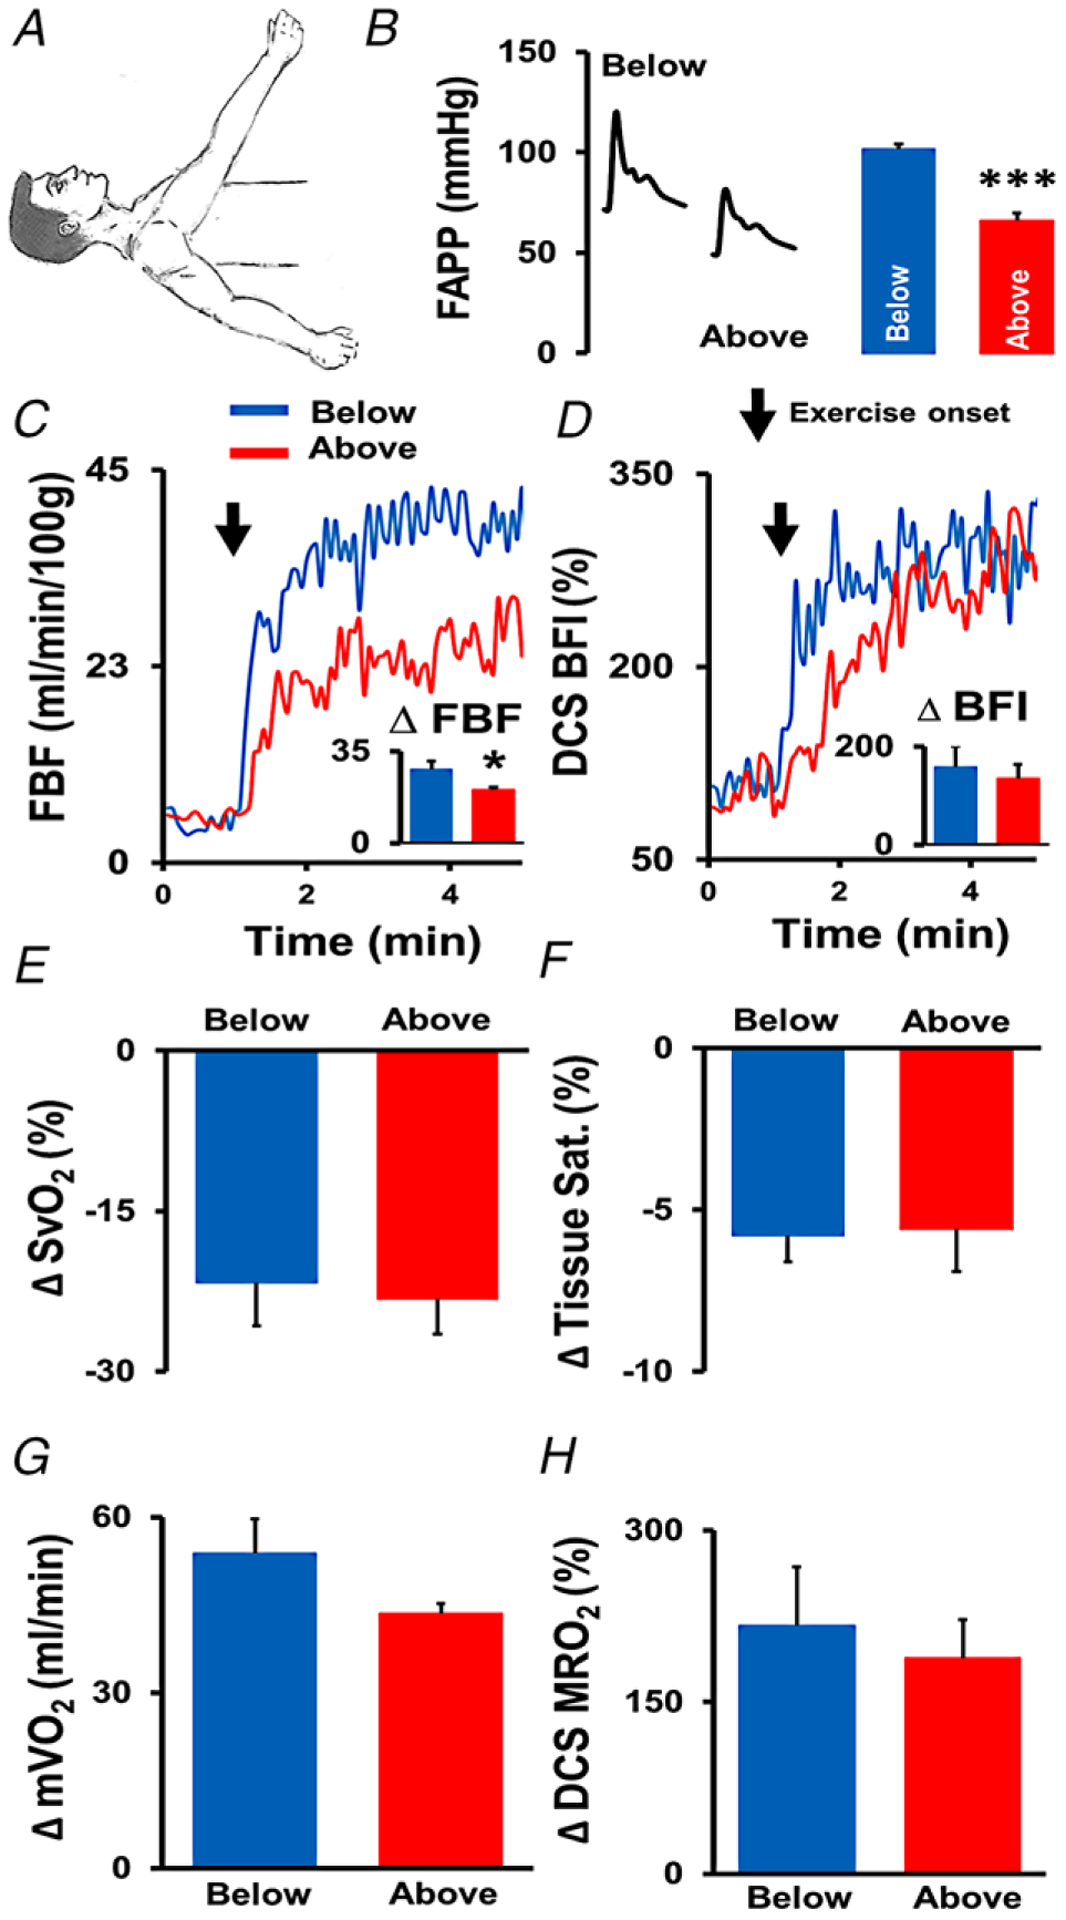
Figure 3. Manipulation of forearm arterial perfusion pressure (FAPP).

The exercising arm was positioned above and below the level of the heart to experimentally manipulate skeletal muscle oxygen delivery (A and B). Red lines and bars represent the above heart condition, and blue lines and bars represent the below heart condition. *** denotes a significant difference between arm positions (P < 0.001). C, forearm blood flow indexed to 100 g of lean tissue (measured by Doppler ultrasound) in a representative subject at rest and during exercise, with group mean Δ data (change from rest) displayed in the corresponding figure inset. * denotes a significant difference between arm positions (P = 0.02). D, microvascular tissue perfusion (measured by DCS-derived blood flow index (BFI)) in the same representative subject at rest and during exercise, with corresponding group mean Δ data (change from rest) in the figure inset. E, mean change in venous oxygen saturation () during exercise in each condition. F, mean change in NIRS-derived tissue saturation () during exercise in each condition. G and H, mean changes in skeletal muscle oxygen uptake () and NIRS–DCS-derived muscle relative oxygen uptake (MRO2) during exercise in each condition. n = 8. Arrows denote the onset of exercise. Data reported as means ± SEM.
