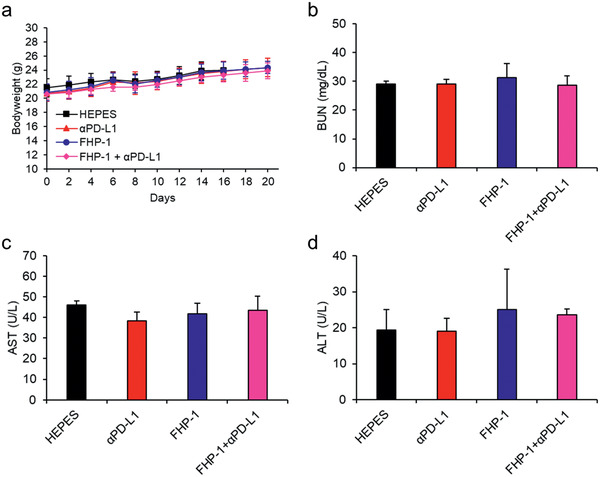
Figure 7.

Toxicological profile. a) Body weight measurement. CT26‐bearing mice were treated with the same regimen of antitumor efficacy study and body weight was measured every other day. Data represented as mean ± S.D. (n = 6). b–d) CT26 tumor‐bearing mice were treated with αPD‐L1, FHP‐1, and FHP‐1 plus αPD‐L1 along with HEPES as a control. Blood was collected on day 2 after the last FHP‐1 treatment, and BUN for kidney toxicity and AST and ALT for liver toxicity were determined for each mouse. Data represented as mean ± S.D. (n = 3).
