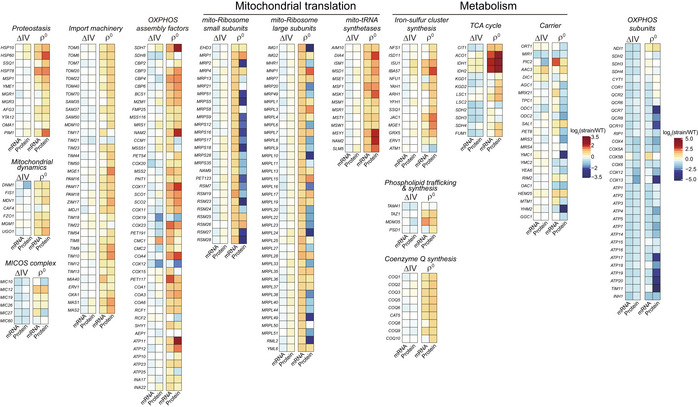
Figure EV2. Correlation between mRNA and protein level changes of selected mitochondrial proteins. Related to Fig 2.

Heat map plots of the mRNA and protein level changes of genes encoding selected functional groups of mitochondrial proteins (gene list in Table EV1C) in the ∆IV and ρ0 cells.
