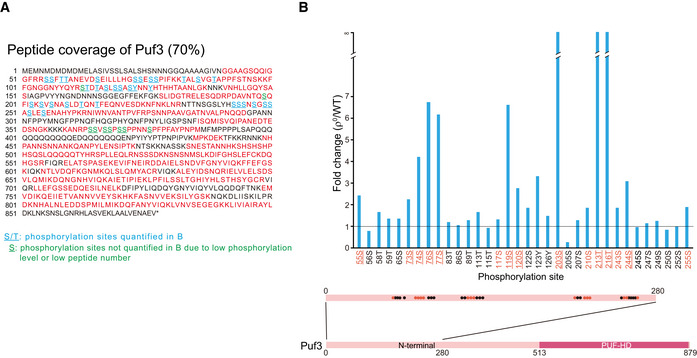
Figure EV5. SILAC analysis of Puf3 phosphorylation. Related to Fig 5.

- Peptide coverage map of Puf3. Peptide sequences covered by mass spectrometry are shown in red. Underlined residues are phosphorylated. Blue underlined residues: phosphorylation sites quantitatively analyzed in Fig EV5B. Green underlined residues: phosphorylation sites not quantitatively analyzed due to low phosphorylation level or low total peptide number. Mass spectrometry data are shown in Dataset EV6.
- Quantitative analysis of Puf3 site‐specific phosphorylation (ρ0 versus WT). The localization of phosphorylation sites at the N terminus of Puf3 is illustrated. Residues mutated in Puf3‐15A are highlighted in red. Residues mutated in Puf3‐11A are highlighted in red and underlined. The horizontal line indicates fold change of 1.
