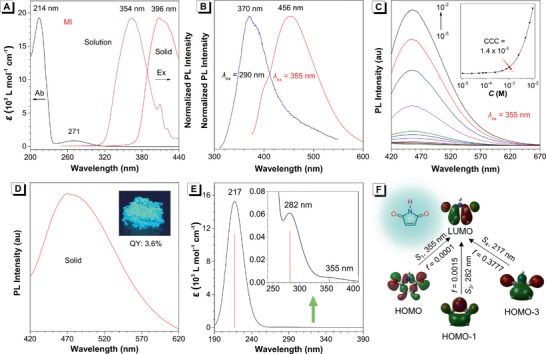
Figure 2.

A) UV–vis absorption (c = 1 × 10⁻⁴ m), and excitation spectra of MI in acetonitrile (MeCN) solution (magenta line, λ em = 456 nm, c = 1 × 10⁻² m) and solid state (red line). B) Photoluminescence (PL) spectra of MI in MeCN at different excitation wavelengths (c = 1 × 10⁻² m). C) PL spectra of MI in MeCN with different concentration (λ ex = 355 nm). Inset: plot of PL intensity of MI versus concentration. D) PL spectra of MI in the solid state (λ ex = 396 nm). Inset: photo taken under 365 nm UV irradiation. E) UV–vis absorption and oscillator strength of MI, calculated by using B3LYP/6‐31G* /CPCM/MeCN method with Gaussian 09 program. F) Spin orbitals involved in the major electronical excitations in MI, calculated by using B3LYP/6‐31G* /CPCM/MeCN method with Gaussian 09 program. Abbreviation: CCC = critical cluster concentration, QY = quantum yield.
