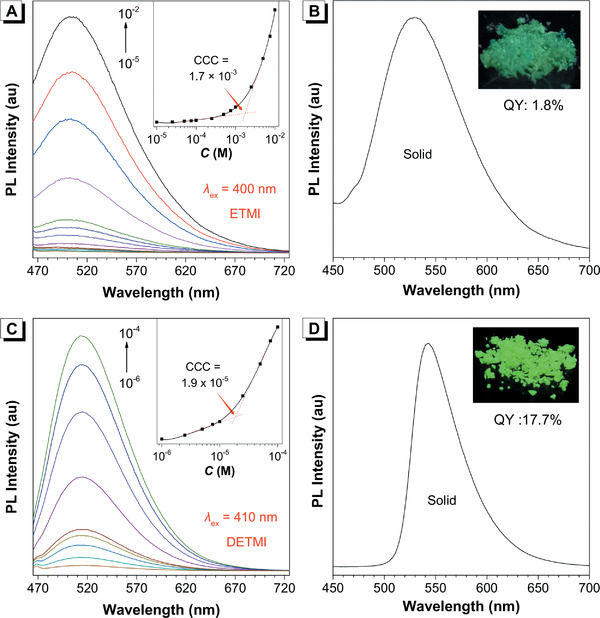
Figure 4.

A) PL spectra of ETMI in MeCN with different concentration (λ ex = 400 nm). B) PL spectra of ETMI in solid state (λ ex = 446 nm). C) PL spectra of DETMI in MeCN with different concentration (λ ex = 410 nm). D) PL spectra of DETMI in solid state (λ ex = 465 nm). Insets: plot of PL intensity versus concentration and photos of ETMI and DETMI in the solid state taken under 365 nm UV lamp. Abbreviation: QY = quantum yield.
